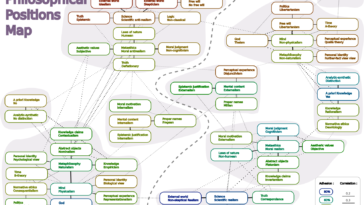
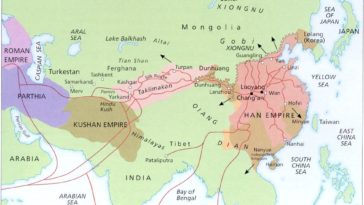
in Infographics Visual : Map of philosophical positions and their correlations among philosophers, based on Bourget & Chalmer’s survey [OC]
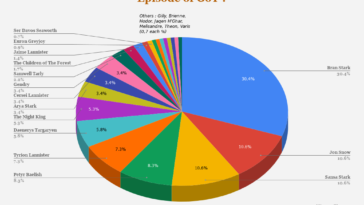
in Infographics data visualization : Who is likely to sit on the Iron Throne, according to bookmakers [OC]