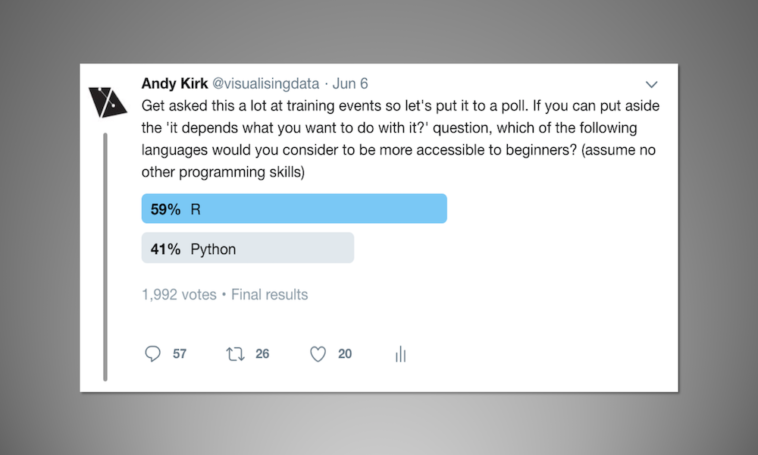
Infographic : A poll about learning R vs. Python
Yesterday I ran a simple Twitter poll about the relative ease of learning R vs. Python. Although a correct answer to this query will ALWAYS have to be based on nuances like pre-existing skills and the scope of need, this originates from people telling me they encounter job or career profiles that list a need for R and/or Python. If they don’t have either, if they prioritised the pursuit of just one, which would be possible to develop a degree of competency more easily, more quickly and more efficiently?
Here is the original tweet and the results, showing a victory for R.
Get asked this a lot at training events so let’s put it to a poll. If you can put aside the ‘it depends what you want to do with it?’ question, which of the following languages would you consider to be more accessible to beginners? (assume no other programming skills)
— Andy Kirk (@visualisingdata) June 6, 2019
There are clearly endless imperfections in the methods of conducting this survey but it was a useful exercises nevertheless, especially because of the many valuable written responses and conversations that emerged out of the original tweet and branched off others too. Because they offered such value I decided to collate as many as possible in to a single Twitter Moment, as published below. Thanks to all who participated!


