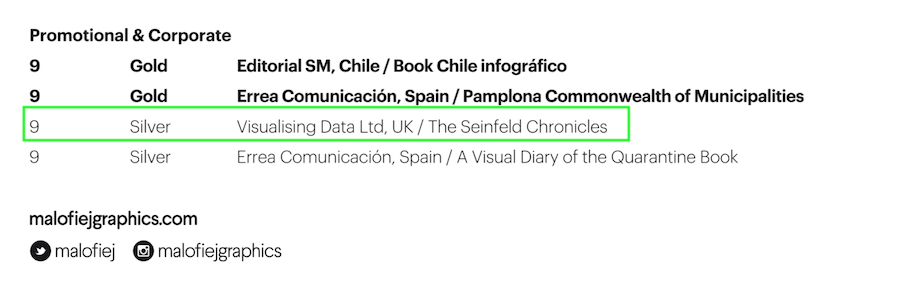
Infographic : A silver medal award from Malofiej 29!
The Malofiej Awards have always been very special to me. It was the first major event I took part in upon becoming a freelance professional, participating as a judge back in 2012 on its 20th anniversary. Five years later, I returned for the 25th event as an attendee to work on my first ever video documentary, as I sought to capture what made it such an important part of the visualisation field’s calendar.
Being a judge (and, by extension, a presenter) is one way to experience Malofiej. Being an attendee is another. The final part of the experience, though, is to submit your visualisation work as an entry for the awards and then have the good fortune of winning a medal.
On Friday 15th June, the results of the Malofiej 29 awards were revealed. They announced that there were 1,144 works submitted from 171 media or design organisations across 32 countries, from which they awarded a total of 156 medals, comprising 25 golds, 45 silvers and 86 bronze medals.
Incredibly, one of those medals was awarded to yours truly! My project ‘The Seinfeld Chronicles’ was awarded a silver for which I am hugely delighted and extremely grateful.

Having been on the inside of the judging process, albeit in person not virtually as it was this year, I am fully aware of the standards required to achieve any type of medal. Any works entered into the Malofiej awards do not necessarily compete against other entries, rather they compete with the established and expected levels of quality, as overseen by the esteemed panel of international jury members. That is why I am so thrilled to have secured a silver for an unnecessary project that took such a considerable chunk of time and effort to complete. I am very thankful to all the judges for their decision to award me this medal and for also helping me complete the full set of Malofiej experiences!


