Infographic : New project: ‘The Seinfeld Chronicles’
I am delighted to announce the completion, the unboxing, and finally now the launch of my new data visualisation project, The Seinfeld Chronicles, a book exploring the rhythm and texture of every episode of Seinfeld. It has turned into the biggest project I have ever worked on.
What is ‘The Seinfeld Chronicles’?
This project is a compilation of visual analysis I’ve been working on for a couple of years to pursue a curiosity I had about the rhythm and texture of Seinfeld, looking into how it was written and how it was produced.
The musicality of language is something defines the signature comedic talent of Jerry Seinfeld and, co-creator, Larry David. Like music, situation comedy has rhythm and it has texture. The rhythm is shaped by its temporal structures and pacing; textures are formed from the arrangements of characters and locations which amalgamate into the comedy. All orchestrated by the storylines and dialogue emerging from the writers.
It is an exploration of the show’s musicality that forms the purpose of this book. It presents a portfolio of visuals produced, intended for people who share my Seinfeld fanaticism. It is a body of work akin to giving the show something of a sports analytics treatment, investigating how Seinfeld and David utilised their resources – the people, places, and the dialogue – to translate their creativity from the page and onto our screens.
The data used in this study did not exist, it had to be manually captured through watching every episode and logging the times, categories, and characteristics of different events within each. Typically, each episode’s data was gathered via two full viewings. The first viewing noted the times of discrete scenes starting and finishing, the locations in which the scenes were set, and the characters who appeared (and when). The second viewing validated the data and recorded which characters caused the laughs (and when). This was a pragmatic solution to ensure the best quality data could be obtained in the most efficient way.
The final product is a 240-page (cover to cover) full-colour, A4-sized, perfect-bound landscape book. Weighing in at 1.1kg it is a dense beast, a suitably physical manifestation of the work I’ve put into it. I’m rarely content with anything I create, but I must admit I have a certain satisfaction with how this has turned out.
Sample contents
Part A opens with high-level summary analysis and statistical observations formed across the nine seasons. It is organised around four distinct topics looking at Seinfeld’s structures, characters, locations, and laughs.
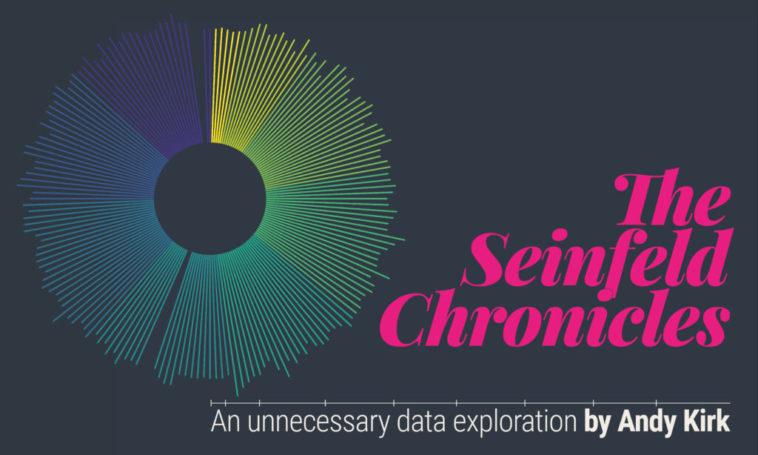
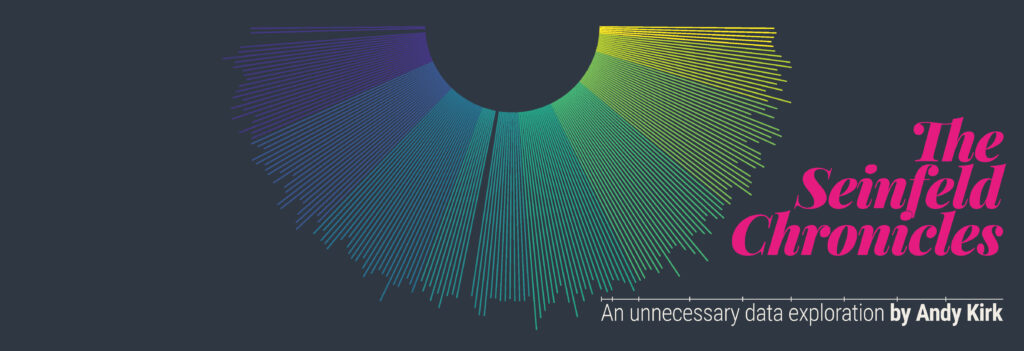
Starting with the outside, and the front cover, the artwork for which is simply a radial bar chart formed out of the IMDb ratings of every episode. With 180 episodes broadcast, the temptation to do something involving a semi-circular layout was too great to avoid (note there are 176 lines with 4 taken out, as I ignored the 4 highlight/’best of’ clip episodes).
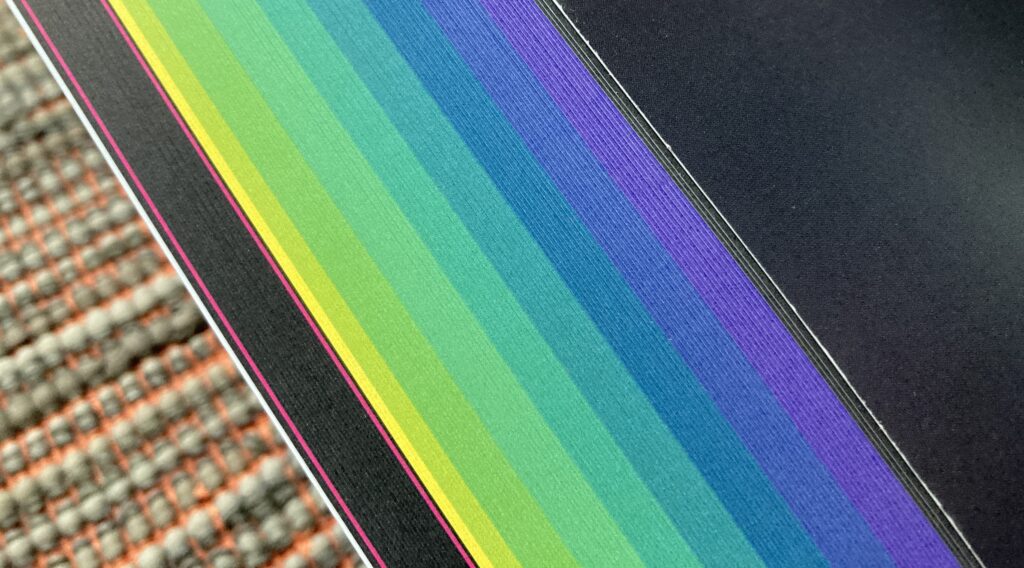
There are no page numbers or contents pages in the book, instead the page edges have a colour bleed to help navigate through the sections of the book, with the colour scales representing the episode contents across the different seasons (1 to 9), using the viridis palette.
The book’s introduction spread provides background information about the motivation and scope of the work.
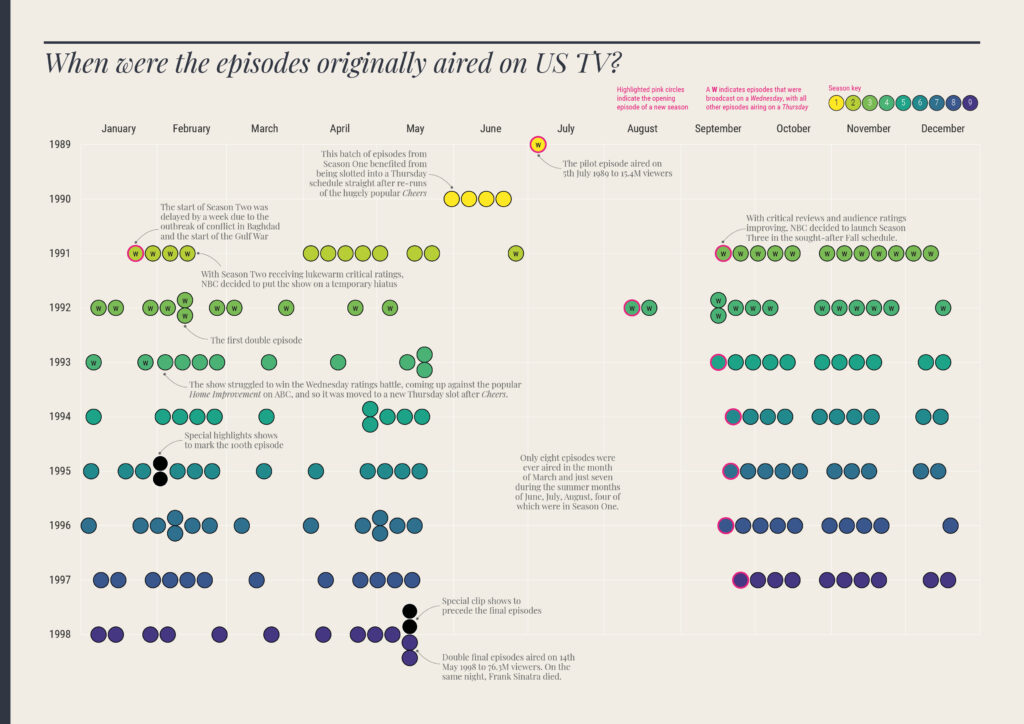
This calendar indicates when each episode was originally broadcast on US TV

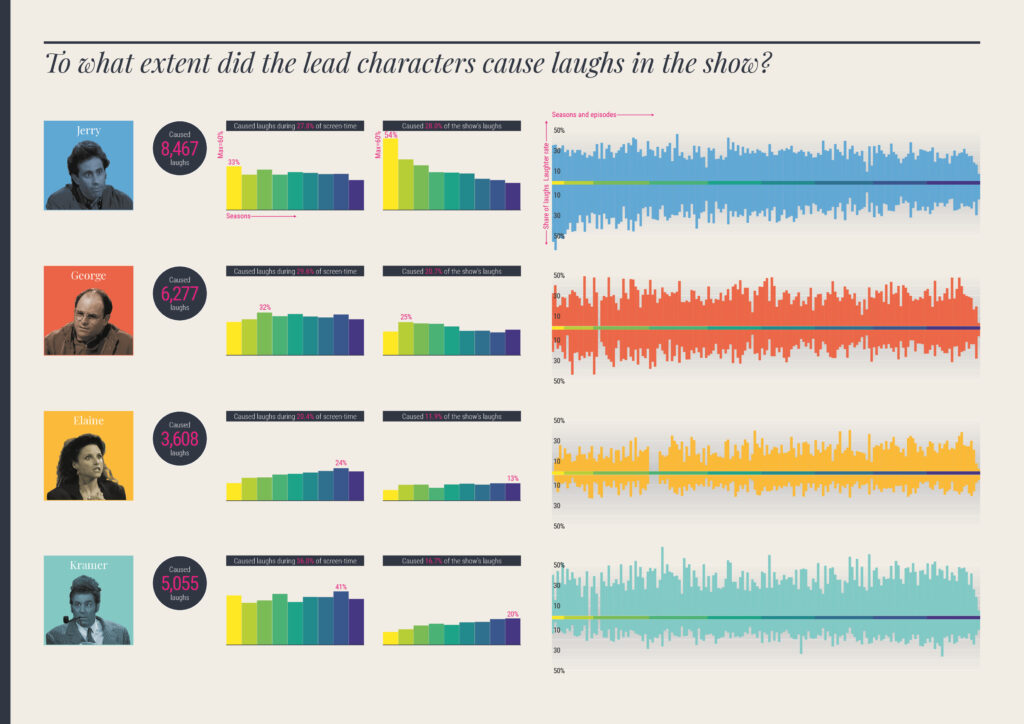
This section of analysis looks at laughter, with summary analysis of the overall laughter rates and share allocated to each lead actor, across seasons and episodes.
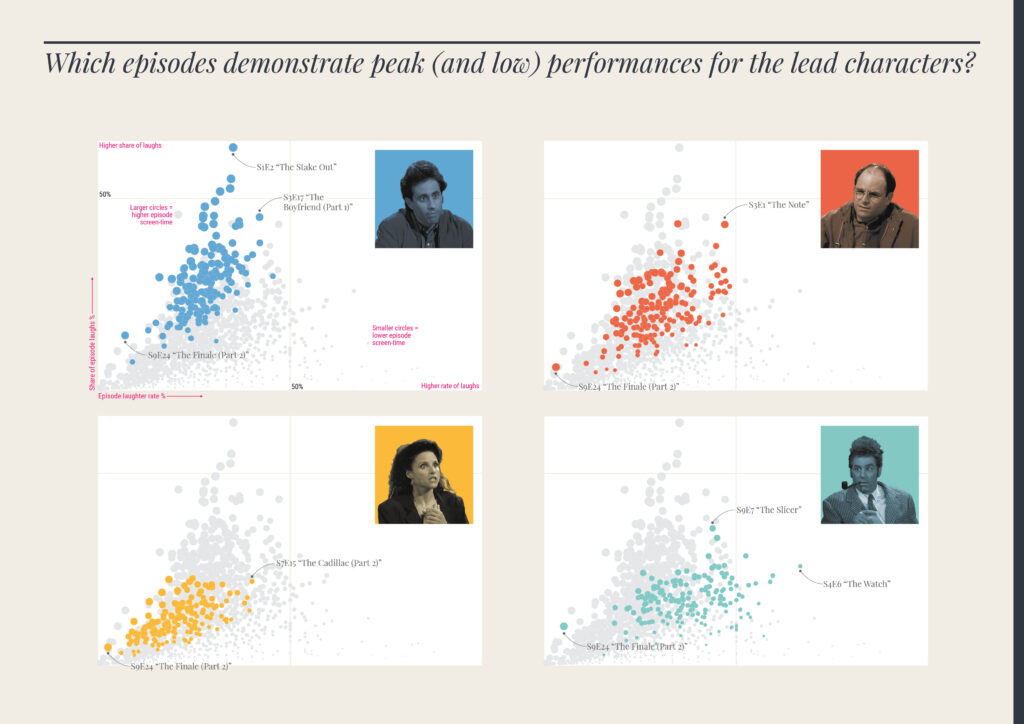
This analysis considers the laughter rate and screen time % of the lead characters, across every episode, to consider which might have been their peak performances.
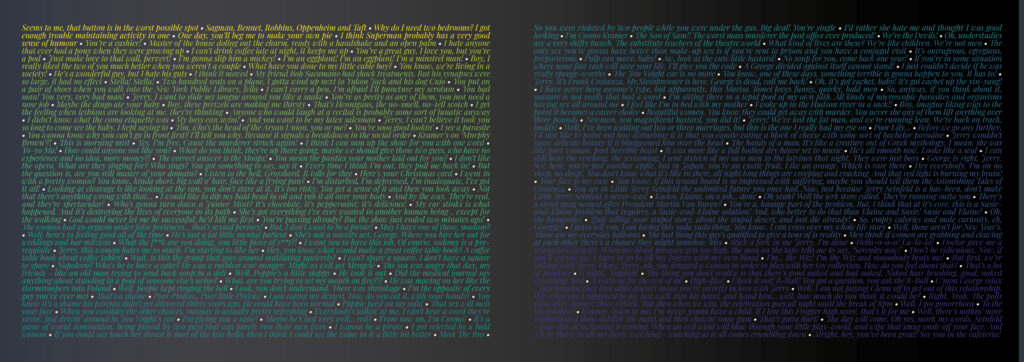
This double-page spread is a section divider, showing a single famous line of dialogue from every individual episode, coloured by the seasons.
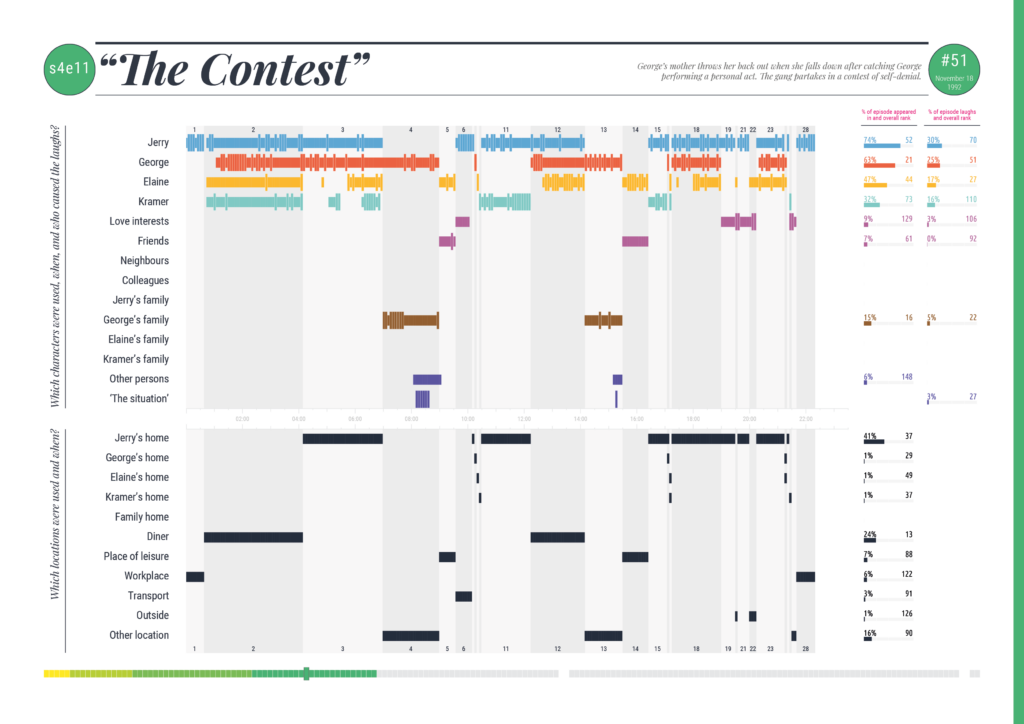
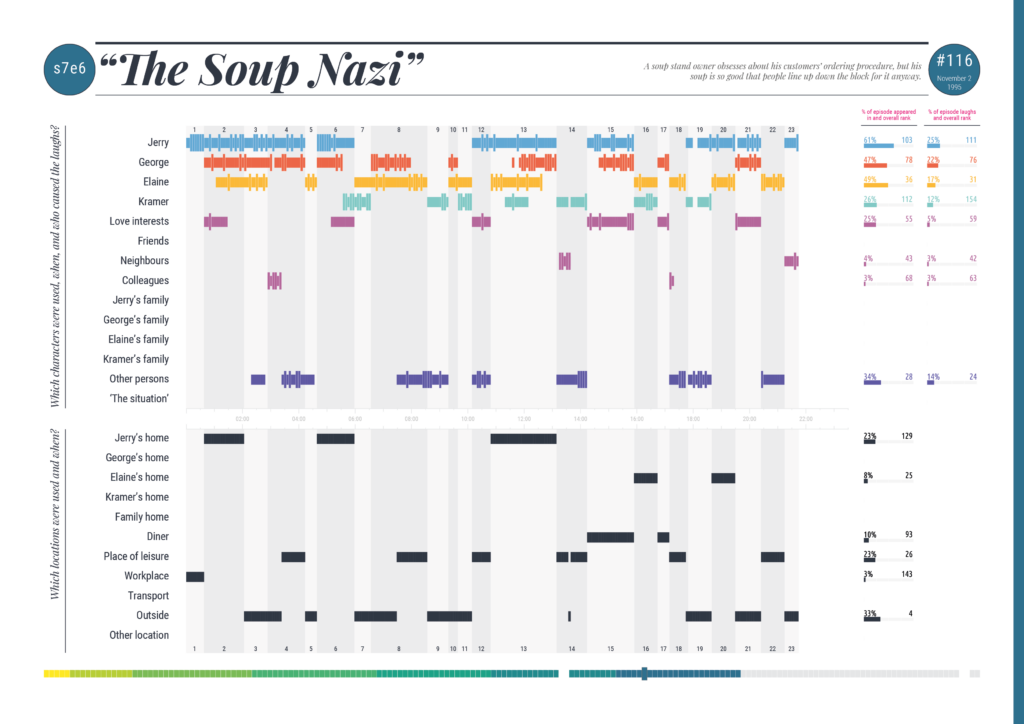
Part B is the centrepiece of the book and shifts the focus of the study to a higher resolution of detail, with visual timelines plotting the composition of characters, laughs and locations for every single episode.
Here are episode timelines for two of the most famous episodes – The Contest and The Soup Nazi, showing the compositions of character screen-time, laughter, location usage and further summary details. At the bottom of each timeline page you will see a progress bar helping to orientate and navigate through all the contents.
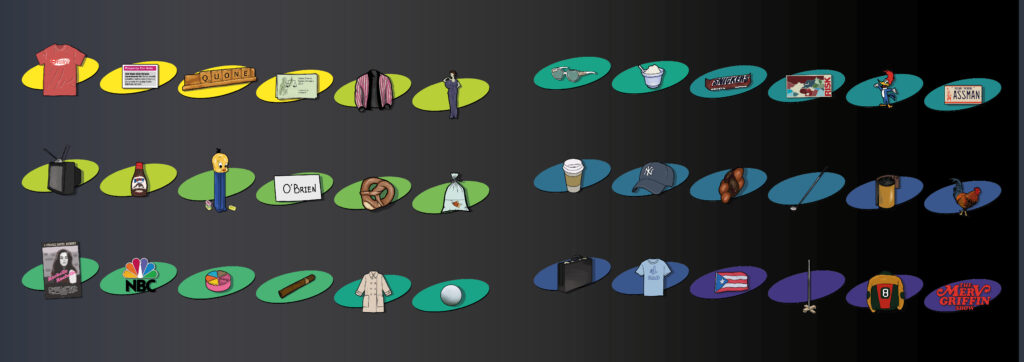
This final double-page section divider has a selection of illustrations of famous motifs from episodes across each season, as illustrated by Matt Knott.
How is the work being published?
This work is being published physically, with a limited-run printed book being made available, as well as the digital version of the document, which you can browse through above or here.
For the print version – the primary intended format – I am making 176 copies available for ‘sale’, with 176 being the number of episodes of Seinfeld (when you ignore the highlight shows, which I did).
However, rather than being made for commercial sale, the dissemination process will follow a pay-what-you-want model, using PayPal’s donation process, with all proceeds, after shipping, going to charity. I am personally handling all the orders, the packing, and the postage of every copy, which will be numbered, signed and accompanied with a ‘thank you’ cover letter.
Over the past few days, over a hundred people on a reserve list (with interest generated from this announcement) have had priority access to make their donations and obtain copies from a first phase release. The people on this reserve list have until Sunday 27th September to take advantage of this early access, after which I will move on to a managed second phase release.
If you want in on this second phase, email me and I will share details of the steps, with no obligation to purchase. I will have to carefully manage an order of priority (first come, first served) to ensure I don’t oversell, so people may find the option to buy is suddenly withdrawn if the stocks hit zero.
To which charities will proceeds go?
From the total donated amounts received from each ‘sale’ I will subtract the costs of the payment processing as well as the funds to cover the costs of shipping. All remaining proceeds will be split equally and donated to two charities.

Firstly, I will be donating 50% of proceeds to Samaritans which is a registered charity “aimed at providing support to anyone in emotional distress, struggling to cope, or at risk of suicide throughout the United Kingdom and Ireland”. Mental health issues were already a significant and growing issue across society, the coronavirus pandemic has made that exponentially worse. These are good people who will value any donation received during this challenging time.
As buyers of the book are spread across the globe, I didn’t want to be overly parochial by just picking a UK charity and wanted to include a cause that is a global concern, namely the environment.
The second charity I am donating 50% to will be the Rainforest Trust, a US/UK registered charity operating globally with the goal of “protecting the most threatened tropical forests, saving endangered wildlife through partnerships and community engagement”. Importantly, 100% of donations they receive are allocated to conservation action.
After just over 36 hours, 69 copies of the book had been snapped up, with buyer donations amounting to around £3,300 which means, after shipping and payment fees, £2,300 has already been raised for charity. The generosity of people is humbling. I will be publishing full details of the monies received, the costs of handling and shipping, and the eventual monies (and receipted proofs) handed over to the charities.
I am not be making any money from this particular ‘sales’ process. I’ve invested my time and expense because I saw this as a passion project that would help me to practice the art of visualising data and continue trying to get better at what I do. I will be translating my experiences working on this process into various talks and presentations over the coming months, for which I will typically expect to charge fees.

I cannot rule out the possibility of their being a future second release of some form of this book nor that it will never be published with a more commercial slant. However, there are no plans now to embark on that and it would need to be a partnership, so if any publishers or commercial folks from Sony/NBC/Netflix were to get in touch about a joint publication…


