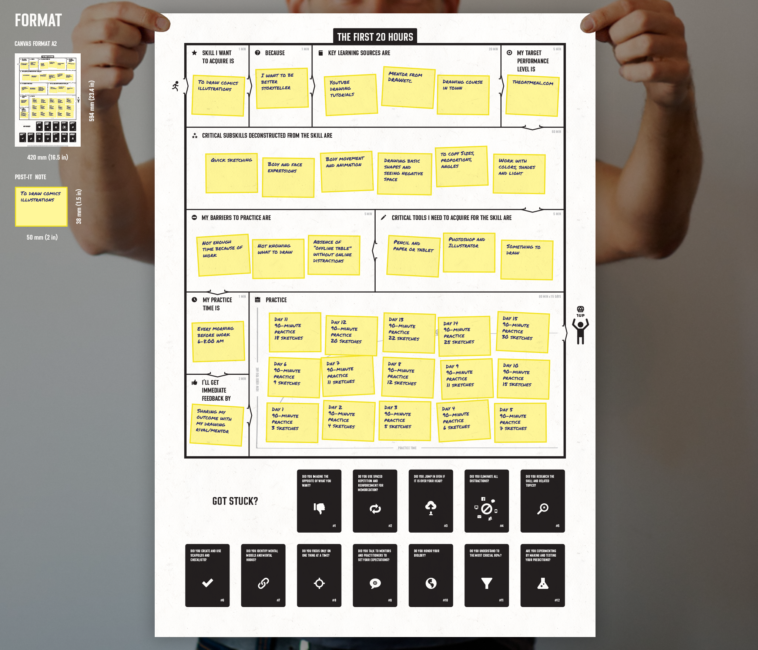
Infographic : Not sure if this is the right place for it, but I made a poster (for sticky notes) for myself based on the book ‘The First 20 Hours’ to help me start learning new things systematically. [OC]
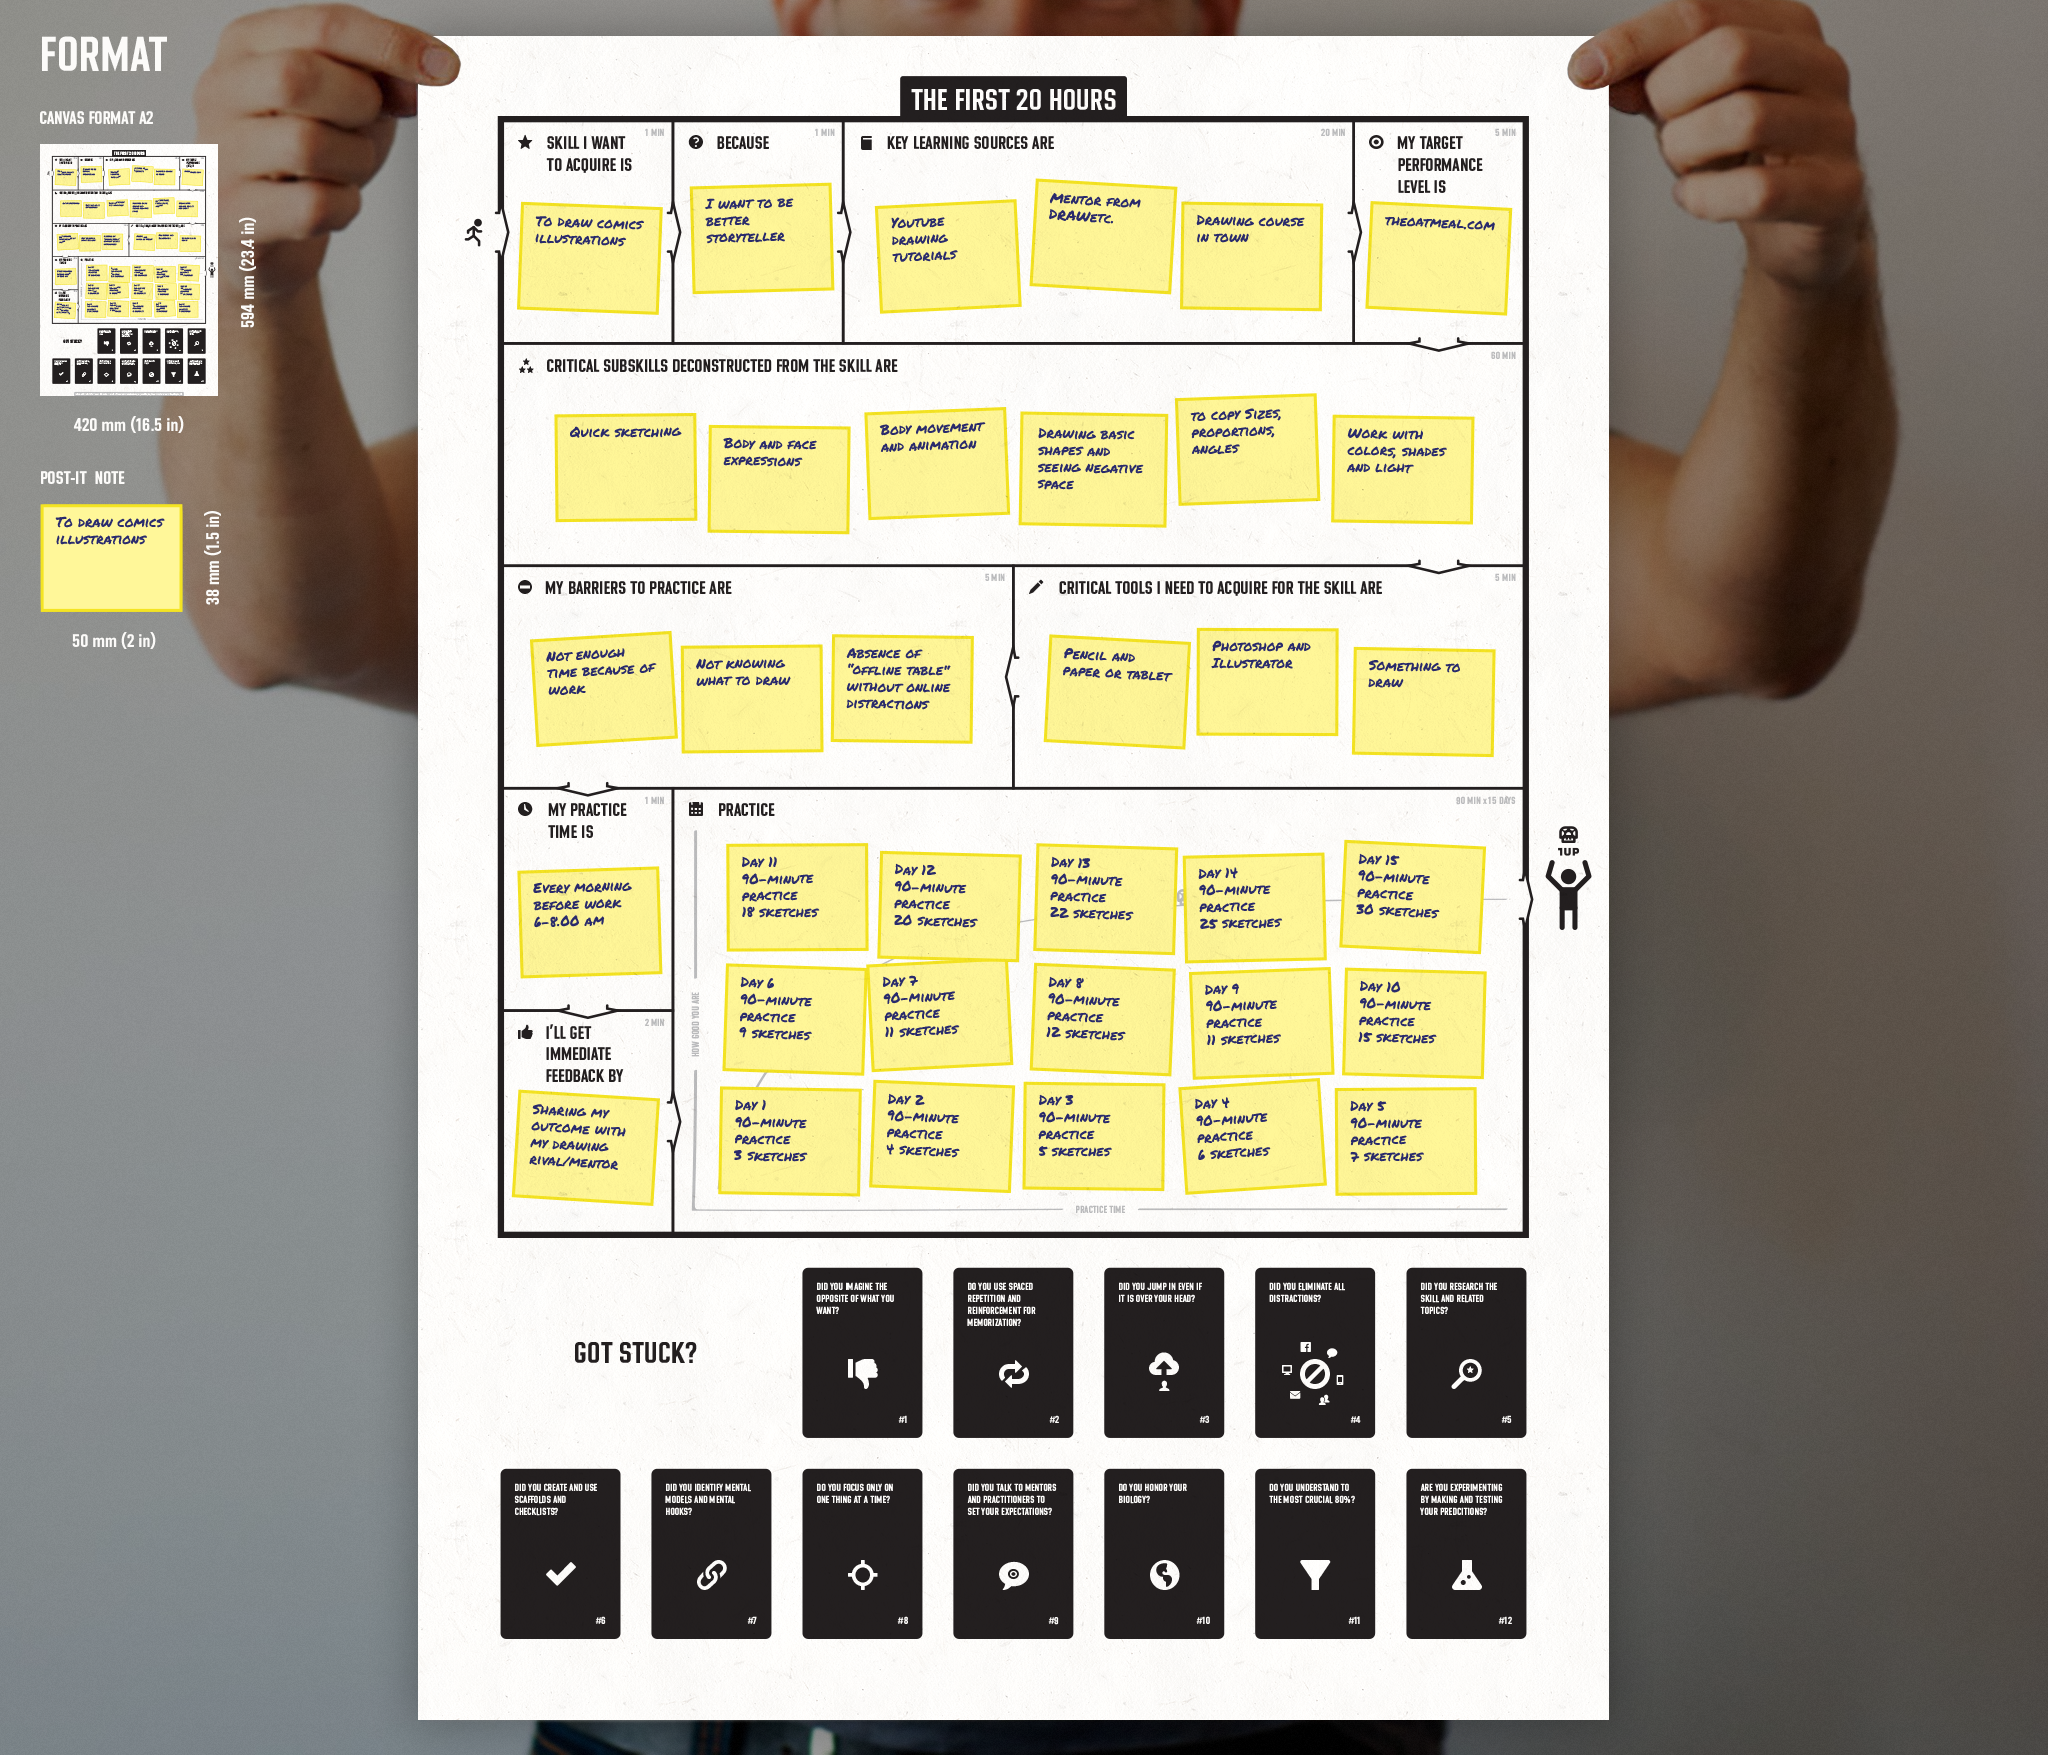
Not sure if this is the right place for it, but I made a poster (for sticky notes) for myself based on the book ‘The First 20 Hours’ to help me start learning new things systematically. [OC]
By michalsobel
Information graphics, visual representations of data known as infographics, keep the web going these days. Web users, with their diminishing attention spans, are inexorably drawn to these shiny, brightly coloured messages with small, relevant, clearly-displayed nuggets of information. They’re straight to the point, usually factually interesting and often give you a wake-up call as to what those statistics really mean.
At infographic.tv we provide handpicked collection of the best infographics and data charts from around the world.
Loading…