Infographic : Translating ‘data visualisation’ – Visualising Data
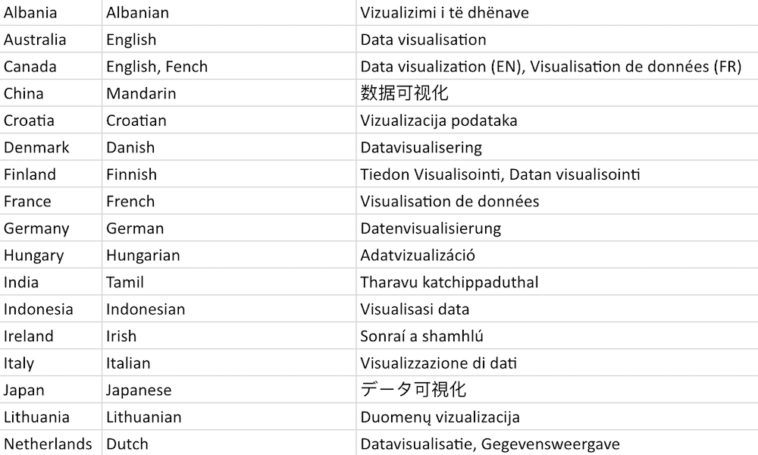
Last week, having learnt about the Finnish translation of data visualisation, I put a tweet out enquiring what other translations are used around the world.
Have just learned that ‘Tiedon Visualisointi’ is the Finnish translation of Data Visualisation. Please reply with more translations in your language…
I’ve always been partial to the Spanish ‘Visualización de Datos’
— Andy Kirk (@visualisingdata) November 30, 2018
Thank you to everyone who contributed to this conversation! I compiled the responses as below:
I would love to continue growing the list of translations across as many different regions and languages around the world. This Google Sheet is open to all to edit so please add your translation!


