Map Info & Chart : Mapping Over 1,000 days of Kiva Microloans [OC] [Interactive] [Video]
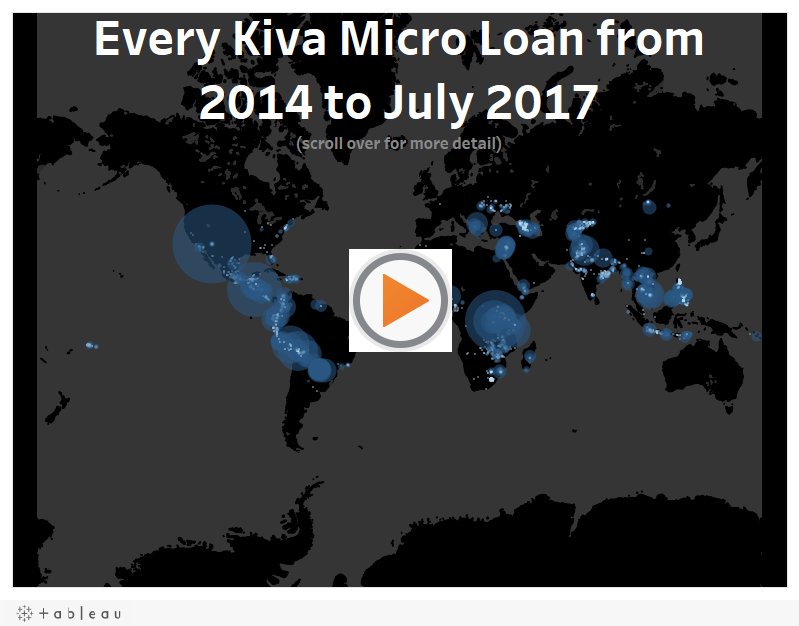
Mapping Over 1,000 days of Kiva Microloans [OC] [Interactive] [Video]
By VanillaMonster
At infographic.tv we provide handpicked collection of the best infographics and data charts from around the world.