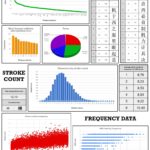
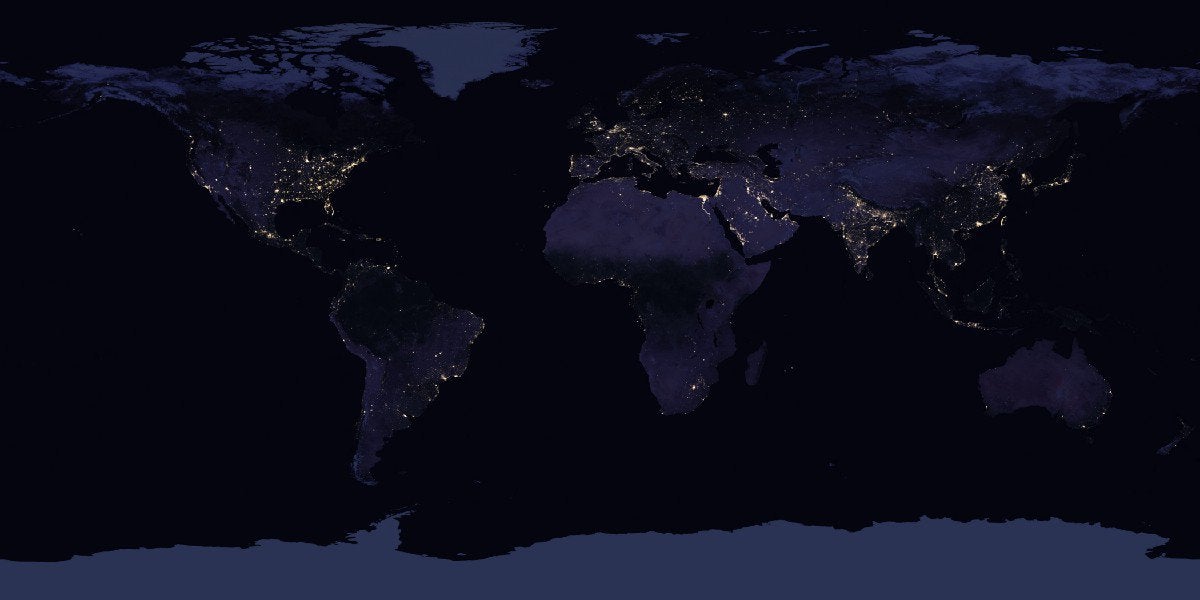
Map Info & Chart : NASA nightlights datasets used to map war, civilizations, economic development and border tensions [OC]
​
[Left: South Korea in 1992, Right: South Korea in 2019](https://i.redd.it/j4jb4hxxjdm31.png)
I analyzed the nightlights datasets by NASA to map some interesting patterns of Human activities. Read them in my blog “[Illuminating human activities using the Night Light](https://towardsdatascience.com/illuminating-human-activities-using-the-night-light-9caceaab7867)”
By ramizsami
At infographic.tv we provide handpicked collection of the best infographics and data charts from around the world.