Map Info & Chart : “Pixelating” the map of Europe
![]()
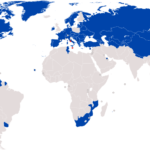
So I had a thought yesterday of pixelating maps, and so I thought to pixelate a map of Europe. I did this by splitting the map into a square grid, then any subsquare with at least 50% land I kept and anything with less than 50% land was removed.
Then I took it a step further and labelled each pixel with the country that had the most area inside each pixel. The result was rather surprising! I decided to make a quiz out of it since I enjoy them:
[here](https://www.jetpunk.com/user-quizzes/176412/pixelated-europe) if you’re interested in that.
—
If not, then the results are as follows. Out of 279 pixels, these countries had the most:
* Russia with 76
* Norway with 18
* Sweden with 17
* Ukraine with 17
* France with 17
* Finland with 16
Also, perhaps surprisingly, some small countries made the cut, including Slovenia, Montenegro and Moldova, which just happened to line up perfectly with the grid.
Also some larger countries are barely represented, like Greece, because much of the squares around it were cut due to lack of land.
I’m not sure it’s overly useful, I just found it interesting.
By Miningstew
At infographic.tv we provide handpicked collection of the best infographics and data charts from around the world.