
Data visualization : I kept track of how many unique puns I made each day in 2018. I made 888 in total [OC]
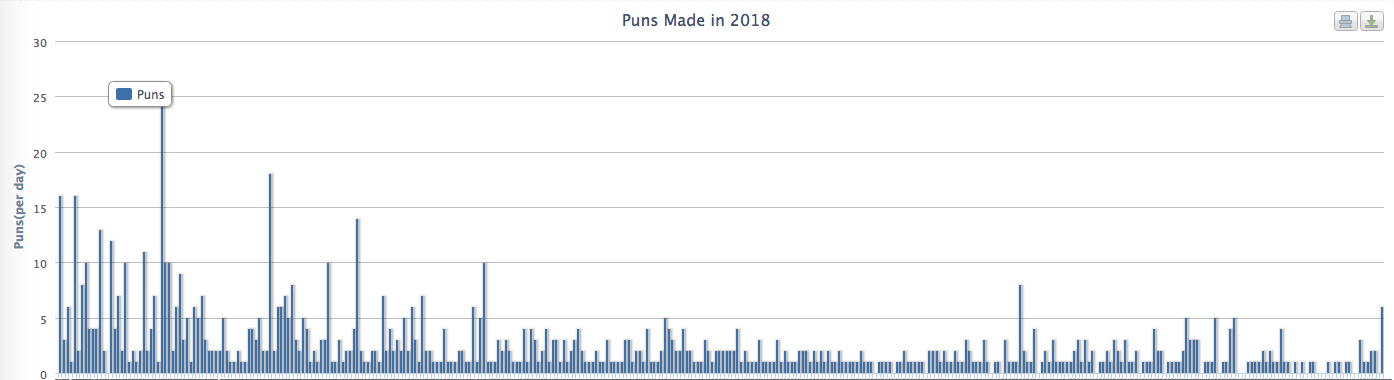
I kept track of how many unique puns I made each day in 2018. I made 888 in total [OC]
By WeegeeFett
At infographic.tv we provide handpicked collection of the best infographics and data charts from around the world.

Loading…