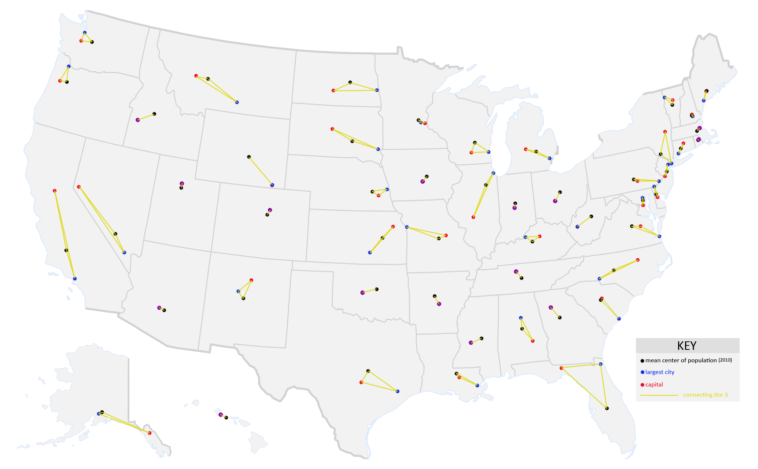
Map Info & Chart : The “triangle” between each US state’s capital, largest city, and center of population [OC][2068×1279]
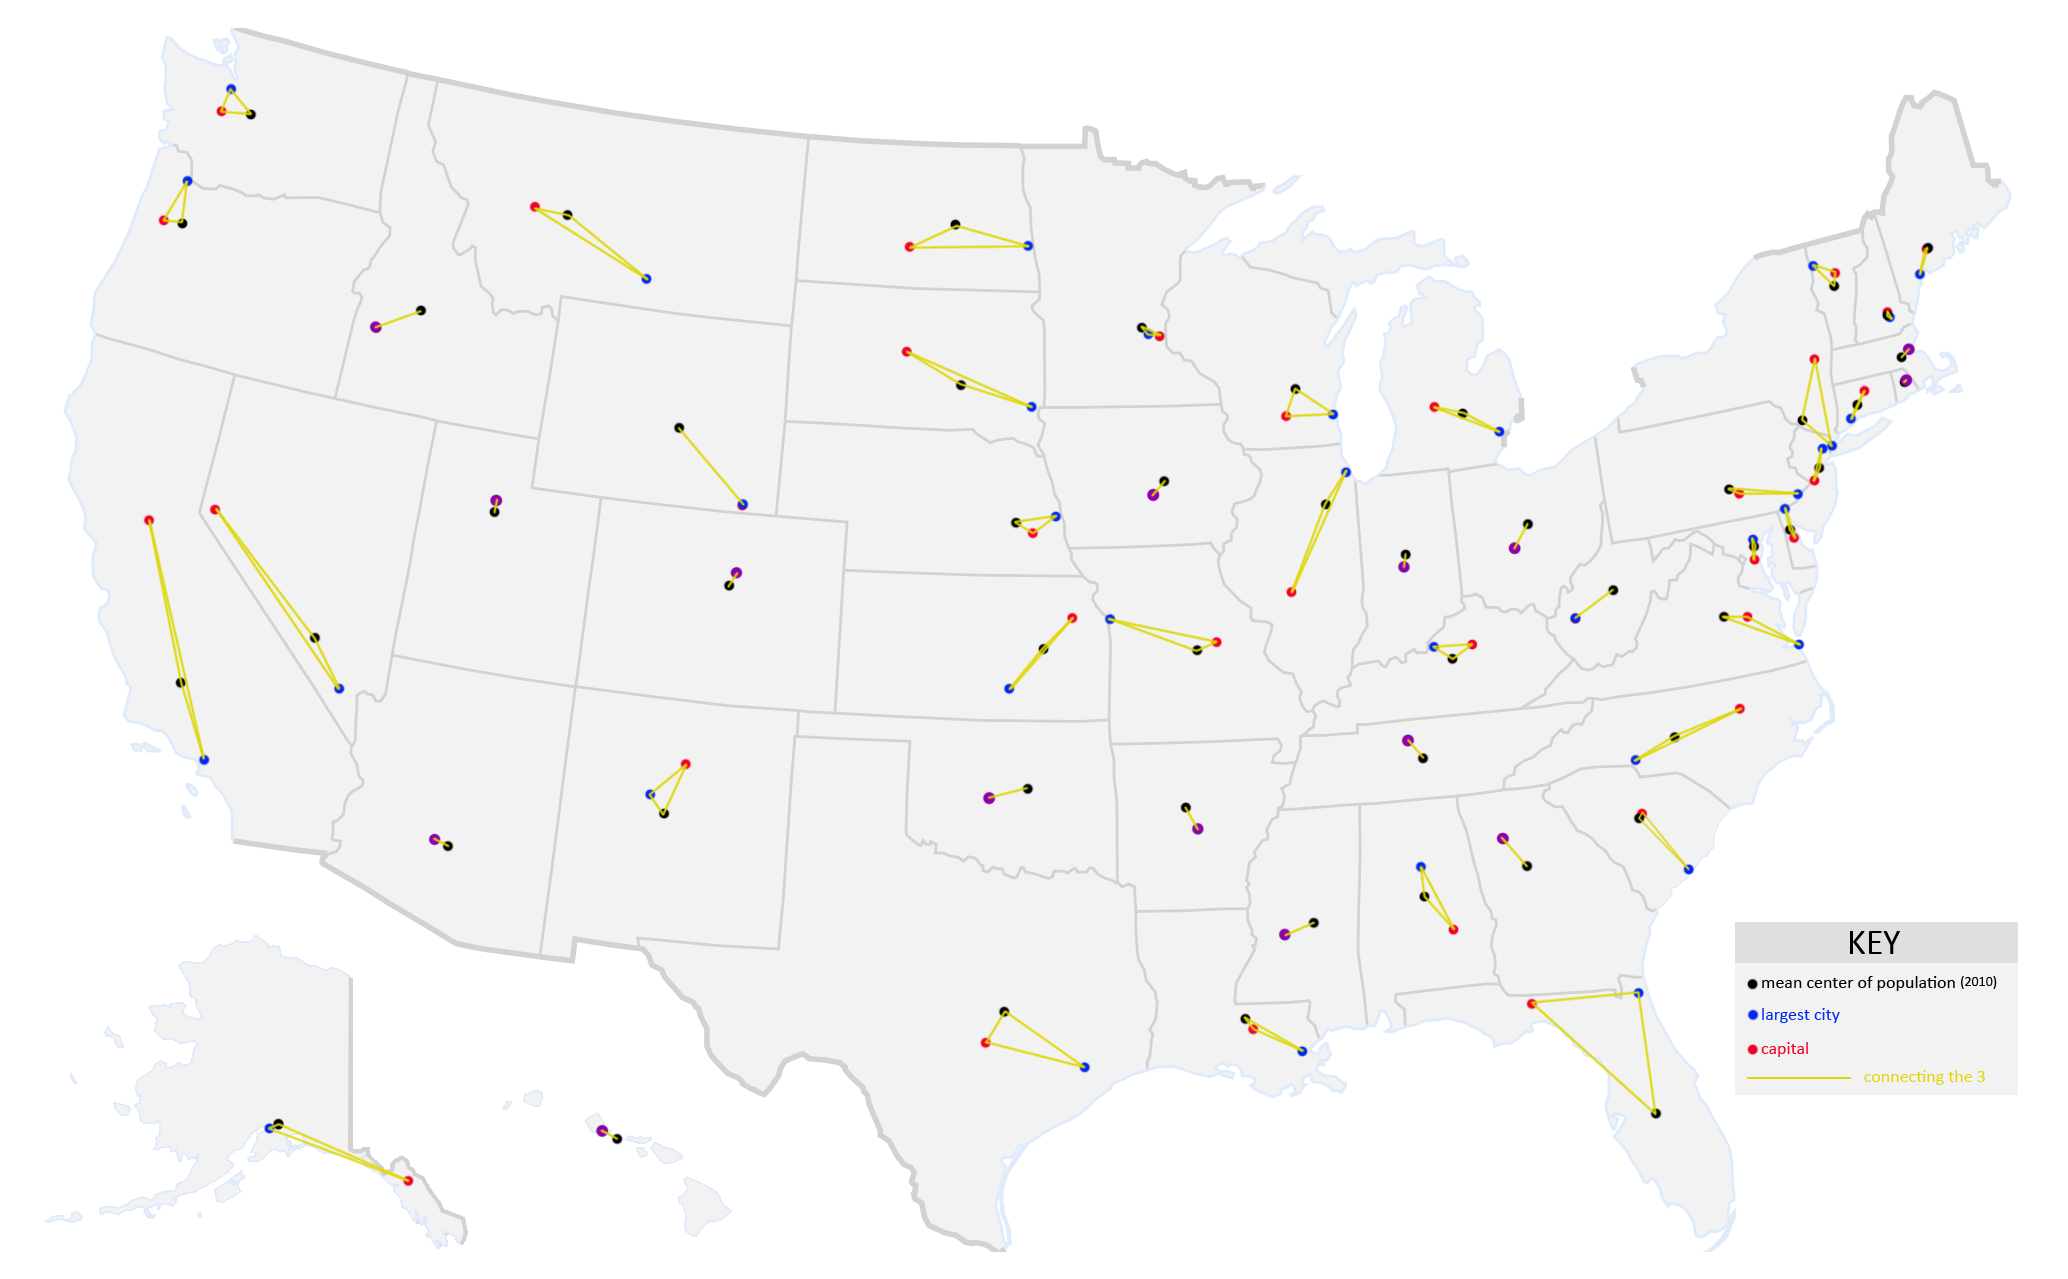
The “triangle” between each US state’s capital, largest city, and center of population [OC][2068×1279]
By e8odie
At infographic.tv we provide handpicked collection of the best infographics and data charts from around the world.