Map Info & Chart : US Installed Wind Power Capacity vs. Potential Wind Power Capacity ~ [1646×988]
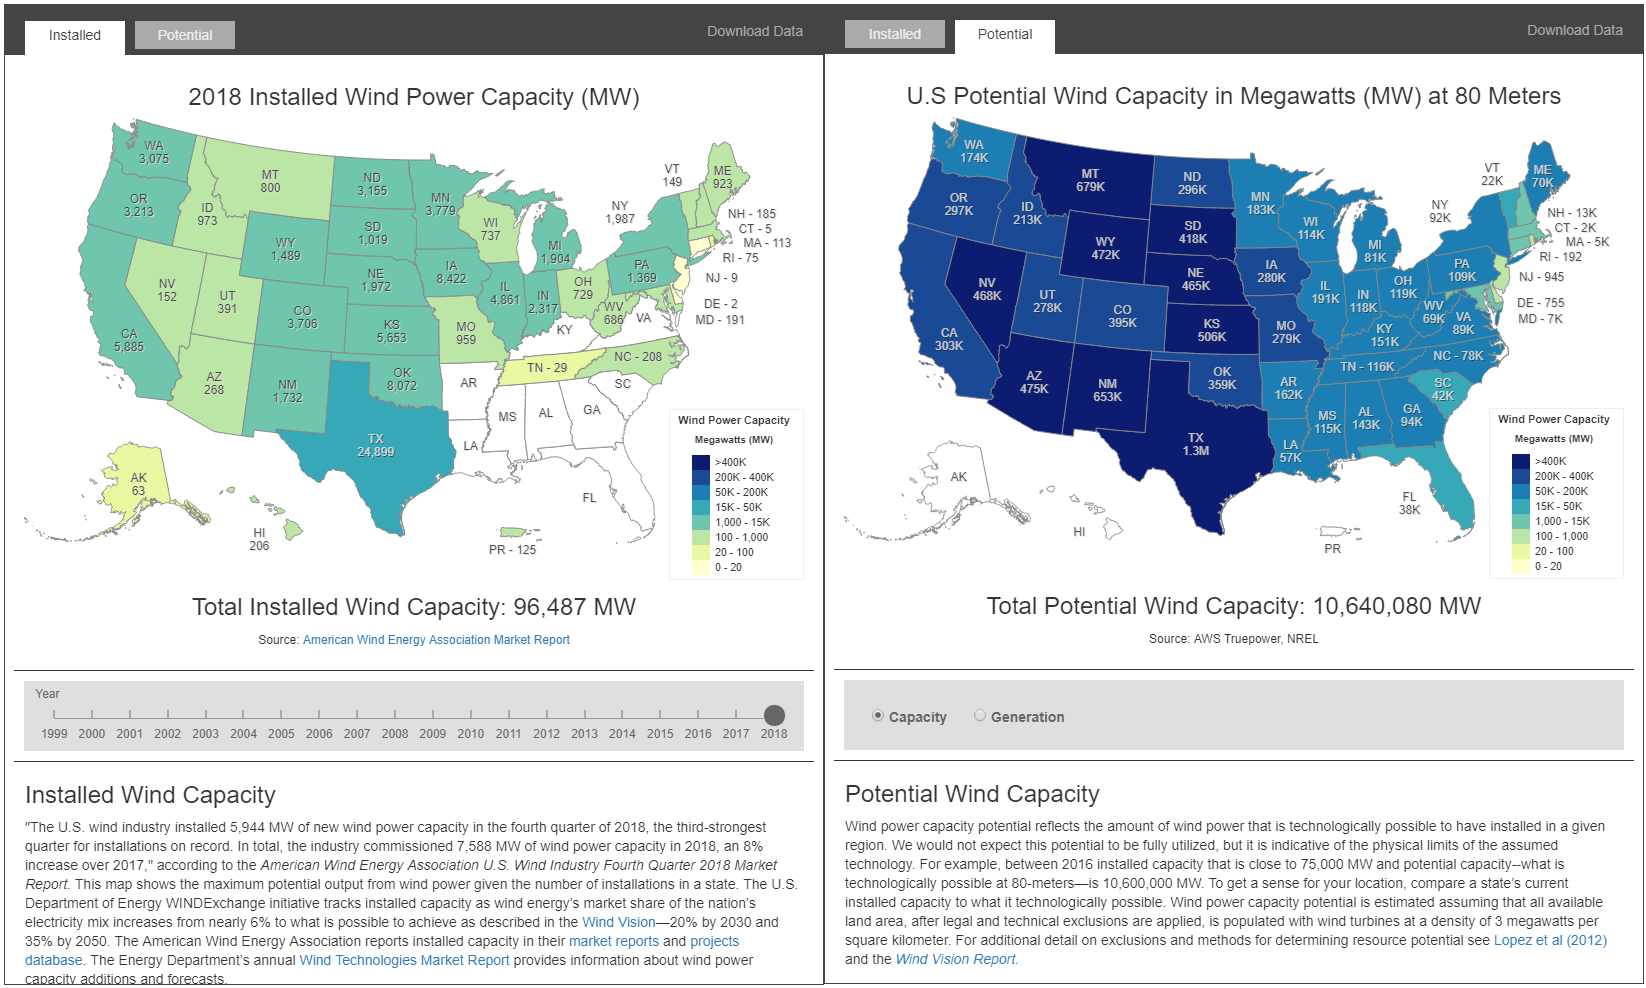
US Installed Wind Power Capacity vs. Potential Wind Power Capacity ~ [1646×988]
By VoightKent
At infographic.tv we provide handpicked collection of the best infographics and data charts from around the world.