in

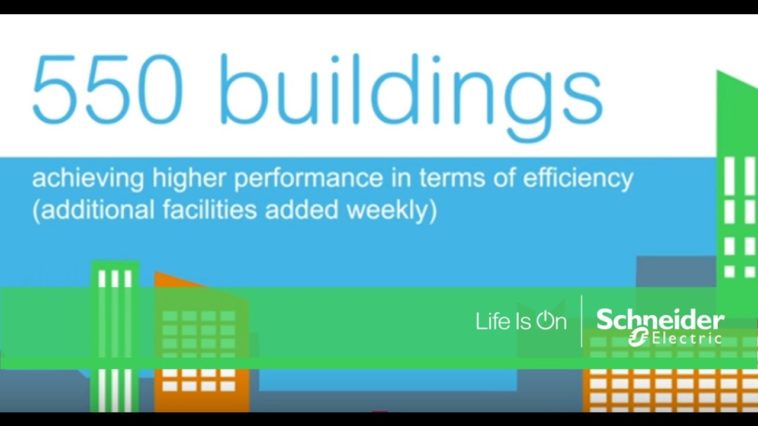
Video Infographic : Building Analytics Infographic Video

Video Infographic : Building Analytics Infographic Video

Video

Description

Schneider Electric Building Analytics makes your building data work for you in order to improve operational and energy efficiency. Join us and enjoy a decrease in maintenance incidents, identify avoidable HVAC energy costs, and record fewer comfort complaints. Learn more,

  • Don’t forget to share this video with your friends !
  • What do you think?

    459 points
    Upvote Downvote

    Leave a Reply

    Your email address will not be published. Required fields are marked *

    Loading…

    Video Infographic : What If The EU Budget Was Only $100 – How Would It Spend It?

    data visualization : Visualisation of different sort algorithms.