in

Video Infographic : Create Dynamic Maps, Timelines, and Infographics with ThingLink

Video Infographic : Create Dynamic Maps, Timelines, and Infographics with ThingLink

Video

Description

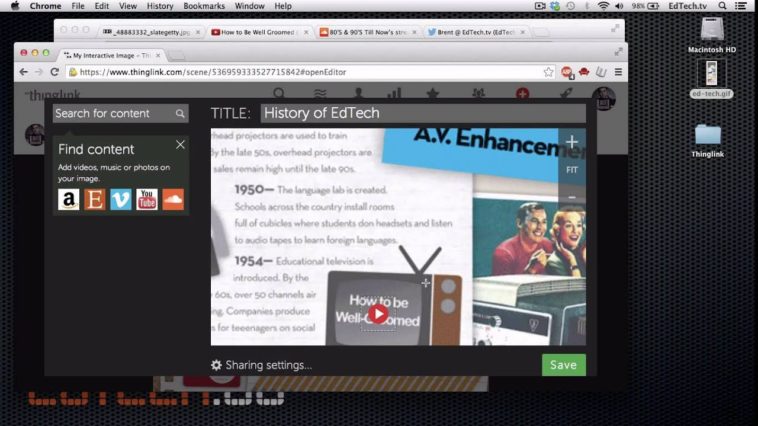
Use ThingLink in your classroom to help your students get a deeper understanding of their learnings through dynamic and interactive images.

Today’s tutorial teaches you how to set up ThingLink to create dynamic maps, timelines, and infographics and use it to grab the attention of your students.

  • Don’t forget to share this video with your friends !
  • What do you think?

    459 points
    Upvote Downvote

    Leave a Reply

    Your email address will not be published. Required fields are marked *

    Loading…

    Video Infographic : US M1 (M1A2) Abrams vs Russian T-90 S – Main Battle Tank / Military Comparison

    Visual : A Guide on How to Win an Argument