Video Infographic : Data & Infographics: Crash Course Navigating Digital Information #8
Video
Description
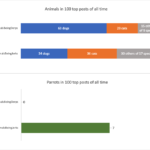
Today, we’re going to discuss how numbers, like statistics, and visual representations like charts and infographics can be used to help us better understand the world or profoundly deceive. Data is a really powerful form of evidence because it can be absorbed quickly and easily, but neither data, nor interpretations of it, are neutral, so today we’re going to discuss how to think critically about the statistics we encounter in everyday life.
Special thanks to our partners from MediaWise who helped create this series:
The Poynter Institute
The Stanford History Education Group (sheg.stanford.edu)
Follow MediaWise and their fact-checking work across social:
MediaWise is supported by Google.
Crash Course is on Patreon! You can support us directly by signing up at
Thanks to the following patrons for their generous monthly contributions that help keep Crash Course free for everyone forever:
Eric Prestemon, Sam Buck, Mark Brouwer, Bob Doye, Jennifer Killen, Naman Goel, Patrick Wiener II, Nathan Catchings, Efrain R. Pedroza, Brandon Westmoreland, dorsey, Indika Siriwardena, James Hughes, Kenneth F Penttinen, Trevin Beattie, Satya Ridhima Parvathaneni, Erika & Alexa Saur, Glenn Elliott, Justin Zingsheim, Jessica Wode, Kathrin Benoit, Tom Trval, Jason Saslow, Nathan Taylor, Brian Thomas Gossett, Khaled El Shalakany, SR Foxley, Sam Ferguson, Yasenia Cruz, Eric Koslow, Caleb Weeks, Tim Curwick, D.A. Noe, Shawn Arnold, Malcolm Callis, Advait Shinde, William McGraw, Andrei Krishkevich, Rachel Bright, Jirat, Ian Dundore
—
Want to find Crash Course elsewhere on the internet?
Facebook –
Twitter –
Tumblr –
Support Crash Course on Patreon:
CC Kids: