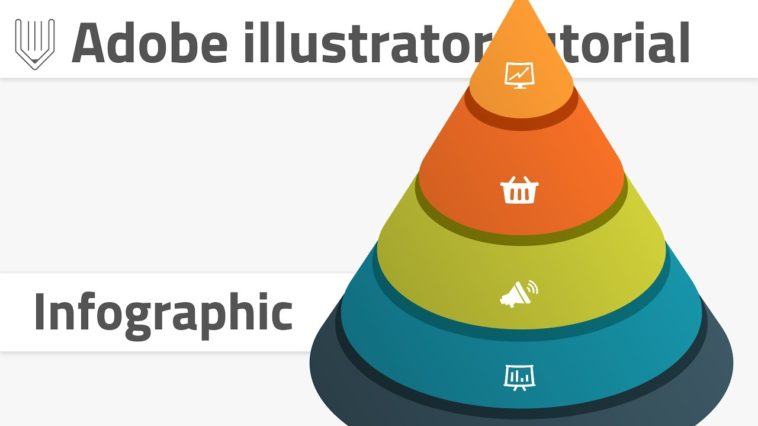
Video Infographic : How to create 3d infographics in Adobe illustrator. Vector cone infographic tutorial
Video
Description
Today’s infographics design tutorial reveals the power illustrator’s 3d tool revolve.
You can also check this tutorial on how to create simple and effective stairs infographic in Adobe ilustrator:
CONTENT:
Document and workplace settings:
Start with triangle :
Rectangular grid :
3d revolve :
Make adjustments to width :
Create shadow and add icons :
Setting up our document
Let’s start with a new document. Go to File|New and set :
Width : 1920px
Height : 1080px
Units : pixels
Start with a triangle :
Grab polygon tool and open polygon dialog box. Give it 550px radius and set number of corners to 3. Set stroke color none, fill color to any bright color.
Select top and right points of it with direct selection tool. Choose option “Align to selection” and align horizontally to the left.
Create rectangular grid
Double click on a rectangular grid tool icon to open a dialog box. Set number of horizontal dividers to 4 and vertical to 0, horizontal skew – to 25%. Click ok and than produce a grid by hitting on the artboard. Size this grid according to your triangle
Download FREEBIE here:
Music :
Bensound – Clear day ( );


