Video Infographic : How to Create an Infographic – Part 2
Video
Description
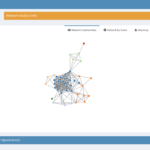
SHOW, DON’T TELL. That’s the general idea of infographics, which use visuals to make numbers/stats/processes easier to understand. While it’s easy to enjoy a well crafted infographic, creating one can be challenging. What type of visual fits your data? How should you style your graphic? What tools can you use to create infographics without starting from scratch?
Making an infographic is a multistep process, so we’ll break this tutorial into two parts. In this lesson, we’ll walk you through how we decided to make our infographic here at Youth Radio.


