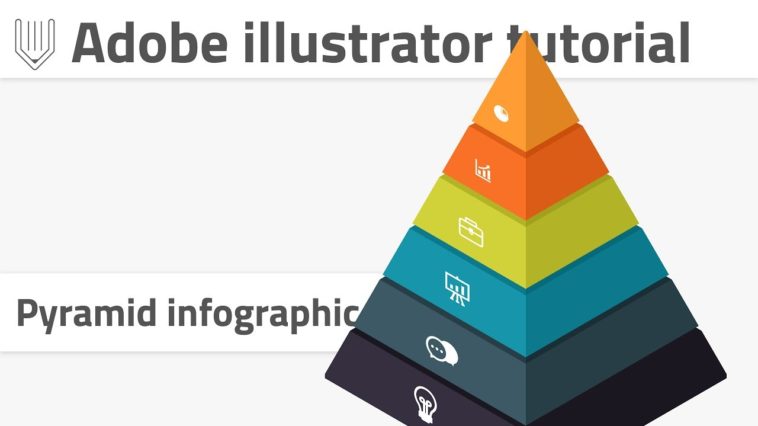
Video Infographic : How to create pyramid infographics in Adobe illustrator. Create 3d object with 2d transformations
Video
Description
😉Today’s infographics design tutorial reveals the power illustrator’s basic shapes and 2d transformations.
You can also check this tutorial on how to create simple and effective stairs infographic in Adobe ilustrator:
🧀
Grab the polygon tool and hit once on the artboard. In opened dialog box set number of sizes to 3 and click ok. On the control panel change :
Width to 955px
Height to 823px
Set fill color to anything you prefer, stroke color to none. Align it horizontally and vertically to the artboard.
Create a triangle
Create hexagon
Return to the polygon tool. This time set number of sides to 6. Hit ok to create hexagon. On the control panel change :
Width to 710px
Height to 820px
Set fill color to none and stroke to 1px black. Align to the center of the artboard.
To create 5 duplicates of hexagon go to Effect|Distort and Transform|Transform… .In opened dialog box set number of copies to 5 and vertical move value to -120px.
Click ok to apply transformation.
Select parent hexagon and go to Object|Expand Appearance. Then increase stroke weight of a group of polygons to 10px.
Add a line in the center
Draw a vertical line with line segment tool holding shift key. Height of this line should be bigger than 823px ( height of the triangle ). Align it both horizontally and vertically and set stroke to black.
Create pyramid’s shape with shape builder tool
Select the entire composition and grab your shape builder tool. Slice all the necessary shapes.
After this manipulation we should have on one side 5 trapezoid and 1 triangle shapes ( I’m going to call them “shapes” ) with small “gaps” in between.
Now we need to ungroup and delete all unnecessary stuff around…
📚Read full article :
🥐Download FREEBIE here:
Music :
Peyruis – Escape – FreeBackgroundMusic ( );
ICONS :