in

Video Infographic : How to edit Excel-Linked Infographics charts and graphs in PowerPoint.

Video Infographic : How to edit Excel-Linked Infographics charts and graphs in PowerPoint.

Video

Description

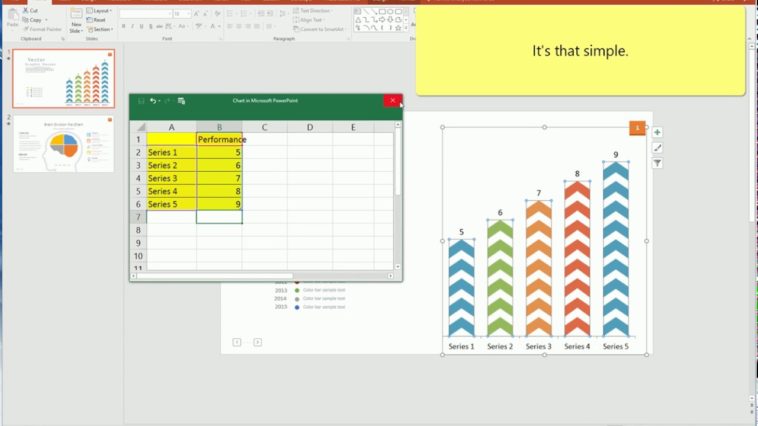
See how easy Excel-linked infographics are to use in PowerPoint. Simply right-click the chart or graph and select ‘Edit Data’ and Excel will pop up. Add your data and the chart will change automatically.

  • Don’t forget to share this video with your friends !
  • What do you think?

    459 points
    Upvote Downvote

    Leave a Reply

    Your email address will not be published. Required fields are marked *

    Loading…

    Visual : [Repost] The Best Completely Free Software Alternatives for Students and Professionals (STEM focus) with a fixed IDE

    data visualization : [OC] Weekly most listened song in Argentina