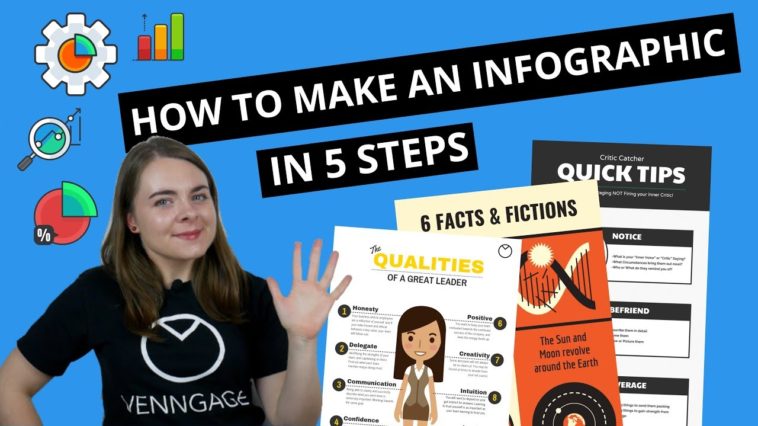
Video Infographic : How to Make an Infographic in 5 Steps (INFOGRAPHIC DESIGN GUIDE & TIPS)
Video
Description
In this episode of Infographics 101, you will learn how to create an infographic from start to finish. For a more in-depth guide with a ton of helpful examples, check out the blog post for this video:
Find all of the infographic templates in this video and more on our templates page:
Other blog posts mentioned in this video:
Recommended data repositories:
* The U.S. Government’s Open Data:
* Open Data:
* Statista:
* Kaggle:
* Pew Research:
* Google Trends Datastore:
* Google Scholar:
* Data is Plural:
* AggData:
* Cool Datasets:
Here’s a quick overview of what the video covers:
You have to be a designer to create good infographics, right? WRONG! Anyone can create an infographic. All you need is an idea, some data and the right infographic design tools.
This infographic design guide walks you through the 5 steps for brainstorming and creating an infographic:
1. Outline the goals of your infographic.
2. Collect data for your infographic.
3. Visualize the data for your infographic.
4. Layout your infographic using an infographic template.
5. Add style to your infographic design.
We’ve included plenty of creative infographic examples, along with an infographic design case study, to make the process easier to understand. We also offer some fundamental infographic design tips AND data visualization tips, so your infographics will look professional.
Make sure you watch the until the end, because we also tell you where you can get your hands on a TON of beginner-friendly infographic templates, including all of the ones we’ve shown in this video.
Remember to SUBSCRIBE to get more helpful infographic design guides.
Follow us on Twitter:
Follow us on Facebook:
Follow us on Instagram:
Music from bensound.com.


