Video Infographic : IELTS Academic Writing Task 1 —How to Approach Multiple Infographics
Video
Description
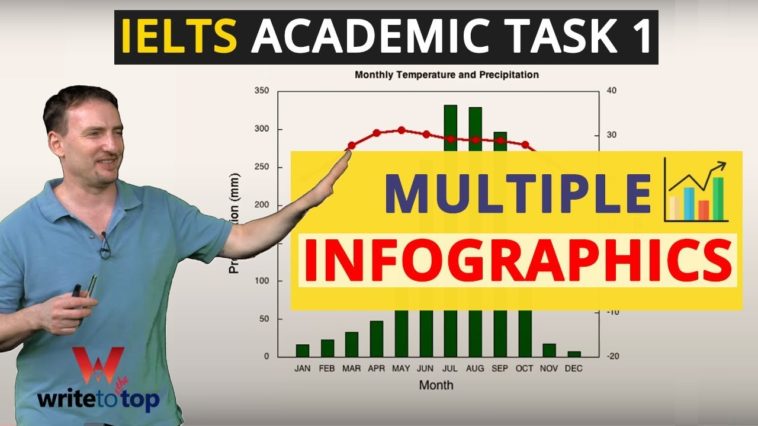
Task 1 of the IELTS Academic writing test asks writers to look at a visual presentation of information and write a report highlighting its main features. It also wants comparisons where appropriate. Many test takers have difficulty selecting this information and writing a concise report/summary. They find it even more difficult when there are two or more visuals to analyze.
In this video we look at some examples of these combinations of infographics and how to look at them, what to look for, and how to present the information they contain. Regardless of whether you are looking at 4 pie charts, a bar graph with a table, 2 bar graphs, and so on, the key is to focus on the important details.
We also analyze a real test taker’s report and find out its strengths and weaknesses, as well as see how a rewrite makes it better.
See the sample from this video here:
Don’t forget to visit for more of our original content.
See our Idea Banks (full of useful vocab):
Would you like to help make Write to the Top even better? Support us:


