Video Infographic : Infographic Bar Chart PowerPoint Animation Tutorial
Video
Description
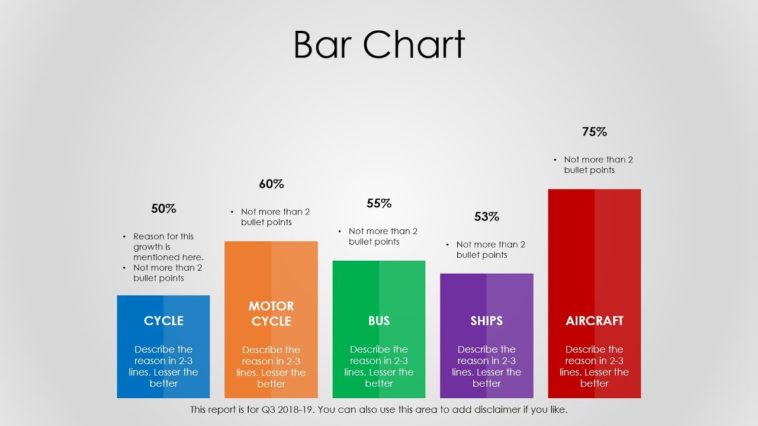
Why use so basic bar charts when you can make professional looking bar charts having lot of data points and information. in few minutes.
A bar chart is a graphical representation of categorical data using rectangular bars. But the default Bar charts haven’t caught up with infographics and data points yet. Thats why you need think beyond.
This series is for busy professional or project managers or program managers. Here is the perfect professional looking Animated PowerPoint Slide Design Tutorial to impress your management.
Love what you see ? Then please leave a comment. Please share and subscribe.
Download this PPT from –
If you want to master the art of presentation, I would definitely recommend following book. One of my subscriber had to say this.
“This book will overturn all the concepts you ever had about the best way to develop and deliver presentations. Especially meant for those of us who have been doing PowerPoints forever…”


