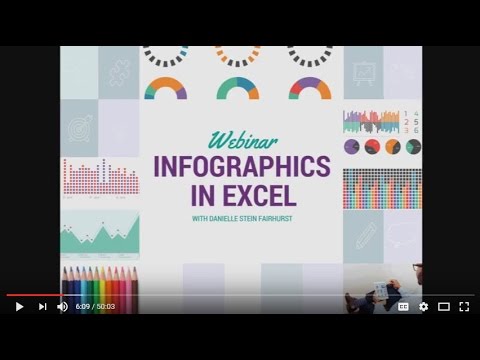
Video Infographic : Infographics in Excel Webinar
Video
Description
Nothing conveys complex information more quickly and effectively than a well-built and visually appealing infographic. They are designed to entertain as well as inform, and the popularity of the infographic in social media has made them an effective way to distill complex information and draw attention to issues that may have otherwise been overlooked.
Danielle Stein Fairhurst gives you a one-hour preview of her new online course as we explore methods and best practice design principles to design your infographic (in Excel!) so that the message is instantly understood by a broad audience.
– What makes a good infographic?
– Using Excel for dynamic visuals
– Dos and don’ts of data visualisation
– Principles of visual perception
Sign up to the online course – www.plumsolutions.com.au/infographics


