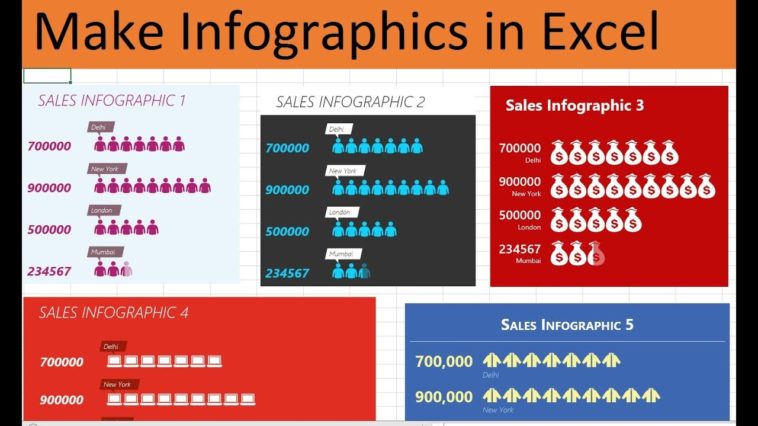
Video Infographic : Make Infographics in Excel
Video
Description
Now you can make Infographics in Excel ! Now you can easily create infographics in excel with the click of a button.
How To Create Infographic in Excel
1 – Go to Insert Tab
2 – Click on People Graph add in in the Add in Section
3 – Select the Infographic template
4 – select your data
5 – Your Infographic in Excel is ready !
Most of the Excel tutorials on making infographics require a lot of advanced knowledge of charts ,etc but this way of making excel infographic is super easy and anyone with excel 2016 can do it.
What are infographics? Infographics are graphic visual representations of information, which is intended to present data quickly and clearly. They can improve a message if presented well and some of the more striking images online these days are infographics. Infographics have evolved in recent years to be for mass communication, strategy and marketing, and thus are designed with fewer assumptions about the readers knowledge base than other types of visualizations.
** Useful Excel formulas and Functions **
10 Most Used Formulas MS Excel
Learn Basic Excel Skills For Beginners || Part 1
10 Most Used Excel Formula
**Most Imporant Excel Formuls Tutorials**
Learn Vlookup Formula For Beginners in Excel
5 Excel Questions Asked in Job Interviews
Create Speedometer Chart In Excel
Learn the Basic of Excel for Beginners || Part 2
Create Pareto Chart In Excel
How to Create Dashboard in Excel
Excel Interview Questions & Answers
To watch more videos and download the files visit
To Buy The Full Excel Course visit . or call 9752003788
Connect with us on Facebook –
Connect with us on Twitter –


