in

Video Infographic : PowerPoint Infographics: Creating the Visual Percentage Graphics (3/3)

Video Infographic : PowerPoint Infographics: Creating the Visual Percentage Graphics (3/3)

Video

Description

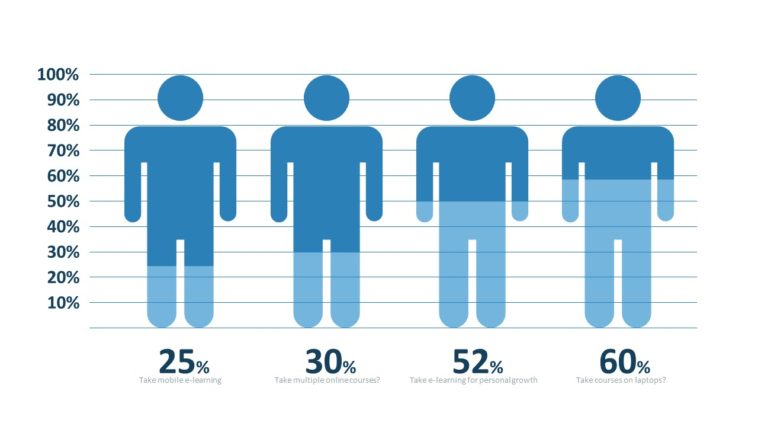
Now that your graphics and masking effect are in place, the final step is to create some guides to help you adjust the emphasis for each percentage graphic in PowerPoint.

In this example, we’re using the guides as temporary rulers but there’s nothing wrong with using the technique to create permanent guides for your own purposes.

Full Tutorial:

  • Don’t forget to share this video with your friends !
  • What do you think?

    459 points
    Upvote Downvote

    Leave a Reply

    Your email address will not be published. Required fields are marked *

    Loading…

    Video Infographic : Logan Paul vs Jake Paul – Who Is Richer and More Popular?

    Visual : Comparing the sizes of nuclear detonations throughout history