Video Infographic : PowerPoint Infographics: Doughnut Charts (Advanced Data-Driven)
Video
Description
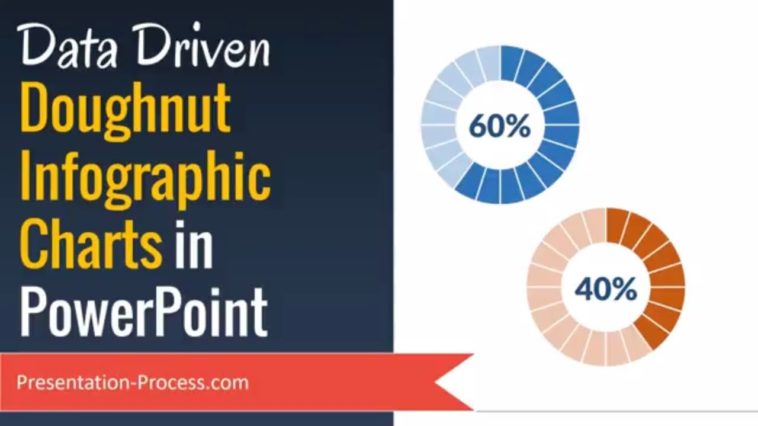
In this video, you will find how to create stylish PowerPoint Infographic with data-driven Doughnut Chart.
You can use this Doughnut chart make your report presentations more interesting and engaging. We use the data-driven charts feature already available in PowerPoint. You can create this same chart in Excel as well.
Such creative infographics help your audience visualize the data better.
This report presentation video is in response to the PowerPoint Question and Answer session held by Ramgopal live on YouTube on Jan 25th, 2018.
Sign Up For Newsletter
=================
Comprehensive All In One Bundle – PowerPoint Templates:
================================
Ramgopal’s PowerPoint Mastery Training Program:
================================


