Video Infographic : Study #1 Infographics – Animated Circle Percentage
Video
Description
NEW: Project file here! :
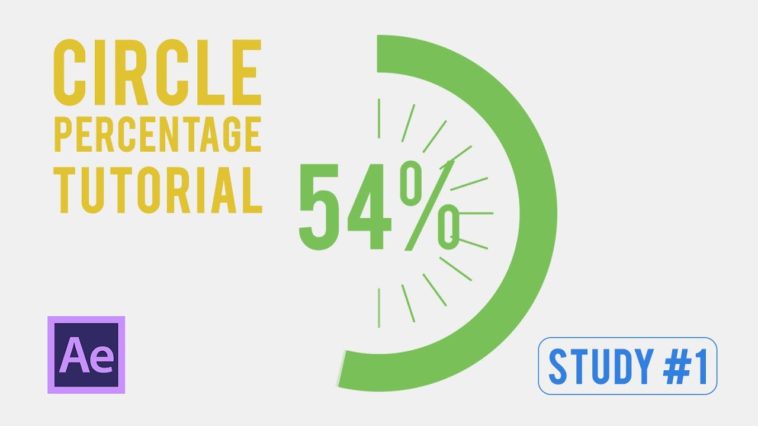
Study #1 – Animated Circle Percentage Tutorial with Codes
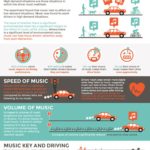
Welcome to this new series of studies around After Effects, a bit of Javascript (not too much I ensure you) and infographics, to build our independence over templates business! We’ll have a look at how we can connect simple movements to % values and how you can build after your own setup of infographics.
Here’s the code used for connecting the Text Source to our Slide control:
beginCount =thisComp.layer(“Counter”).effect(“Slider Control”)(“Slider”);
stopCount = thisComp.layer(“Counter”).effect(“Slider Control”)(“Slider”);
beginTime = 0; // start counting at time = 0
countDur = 5; // count for 5 seconds
Math.round(linear(time,beginTime,beginTime + countDur,beginCount,stopCount)) + “%”
It wasn’t made for this purpose but it is adapted for our conter!
Other tutorials are coming further so subscribe to the channel and get ready for the next studies!
————————————————————–
Check also my website:
www.gabrieletropianomultimedia.com
Endorse me on Linkedin! I will endorse you back!:
For any questions write on the discussion board!