in

Video Infographic : Visual Digital Presentation – Examples of infographics created with Piktochart

Video Infographic : Visual Digital Presentation – Examples of infographics created with Piktochart

Video

Description

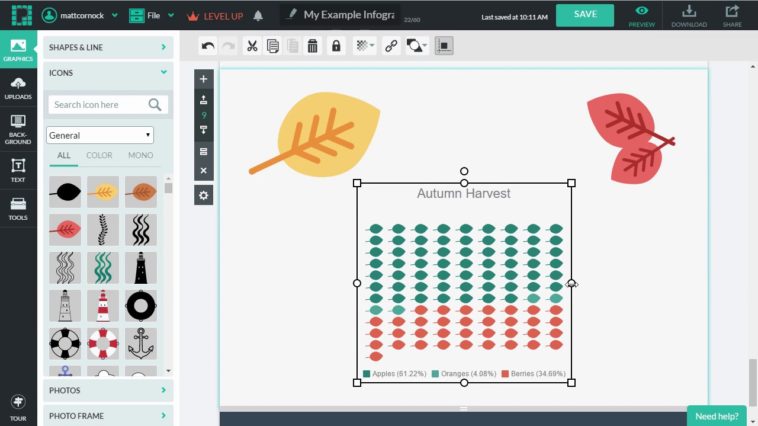
Following on from the previous video showing an overview of Piktochart, here we look at two examples: the map and the icon matrix. Each can be used to highlight a key point or present lots of data visually.

  • Don’t forget to share this video with your friends !
  • What do you think?

    459 points
    Upvote Downvote

    Leave a Reply

    Your email address will not be published. Required fields are marked *

    Loading…

    Video Infographic : American Girls vs European Girls – How Do They Compare?

    Visual : Human Bones