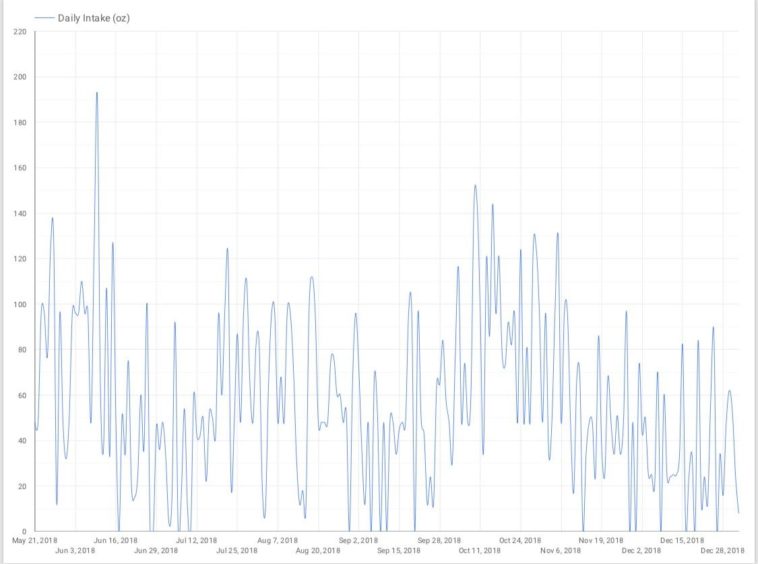
Data visualization : Every ounce of water I had since May, 2018 [OC]
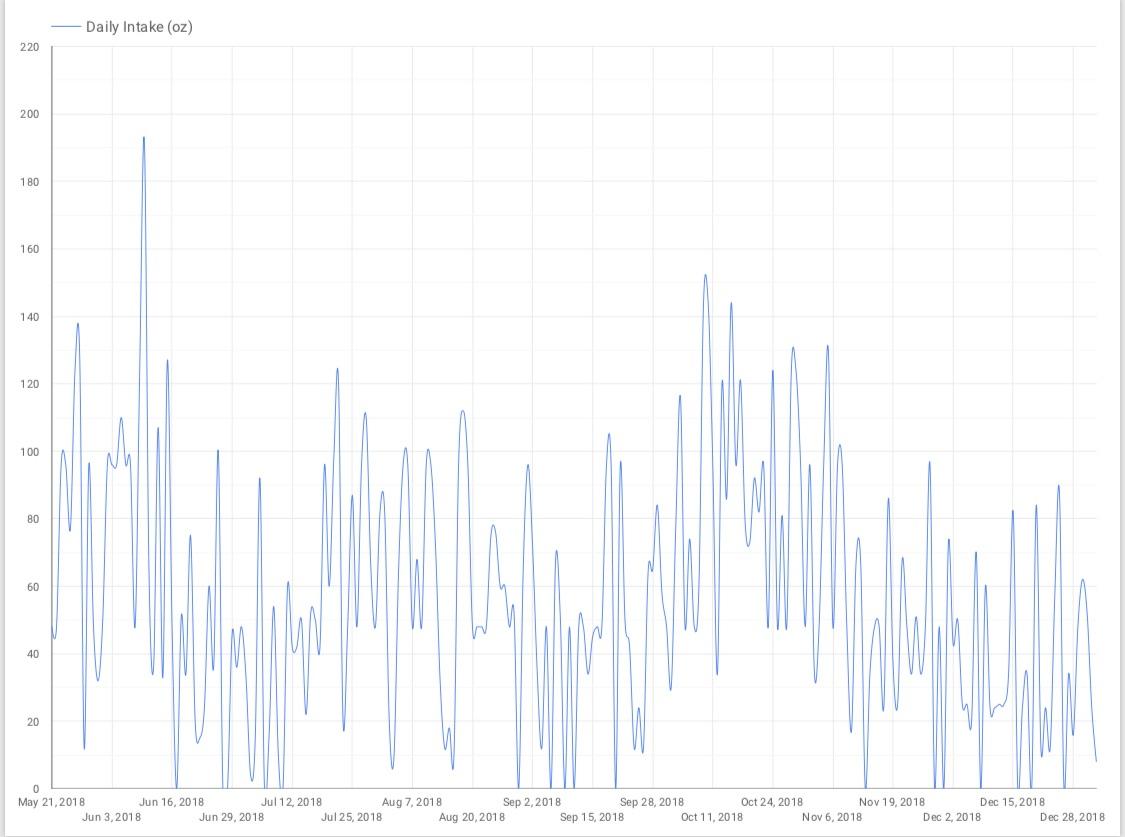
Every ounce of water I had since May, 2018 [OC]
By feharker
At infographic.tv we provide handpicked collection of the best infographics and data charts from around the world.
Every ounce of water I had since May, 2018 [OC]
By feharker
At infographic.tv we provide handpicked collection of the best infographics and data charts from around the world.
Enter your account data and we will send you a link to reset your password.
To use social login you have to agree with the storage and handling of your data by this website. %privacy_policy%
AcceptHere you'll find all collections you've created before.
Loading…