in

data visualization : 2 years of dating, We would note how much we spent when going out to keep track on who’s turn it was to pay. (In the minuses it was my turn to pay, plus hers). [OC]
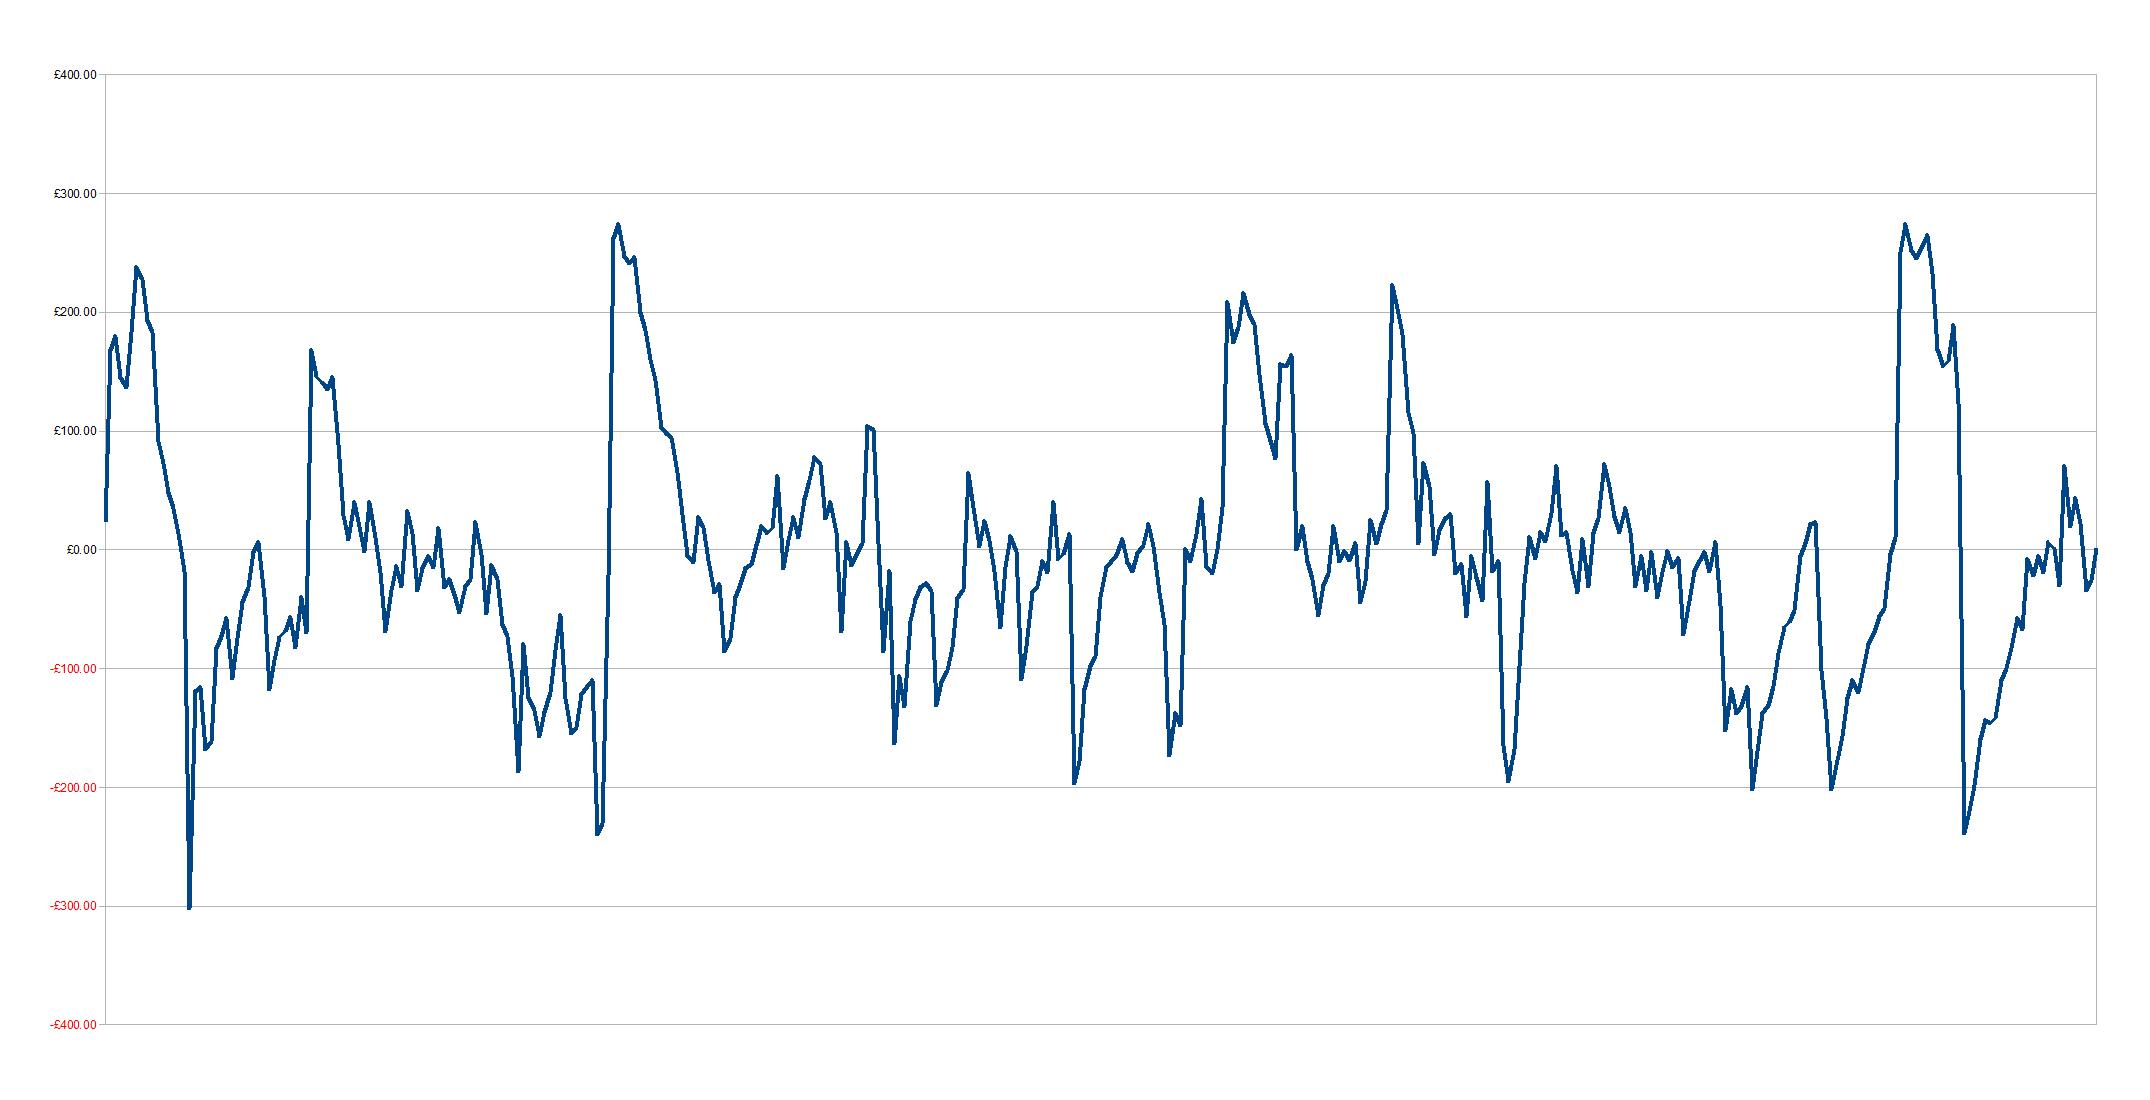
Data visualization : 2 years of dating, We would note how much we spent when going out to keep track on who’s turn it was to pay. (In the minuses it was my turn to pay, plus hers). [OC]

2 years of dating, We would note how much we spent when going out to keep track on who’s turn it was to pay. (In the minuses it was my turn to pay, plus hers). [OC]

By Greg1987

At infographic.tv we provide handpicked collection of the best infographics and data charts from around the world.

  • Don’t forget to share the love !
  • What do you think?

    459 points
    Upvote Downvote

    Leave a Reply

    Your email address will not be published. Required fields are marked *

    Loading…

    Visual : Guide to transition words

    Data Chart : Which Fictional World Holds Your True Destiny? [Infographic