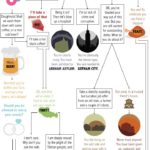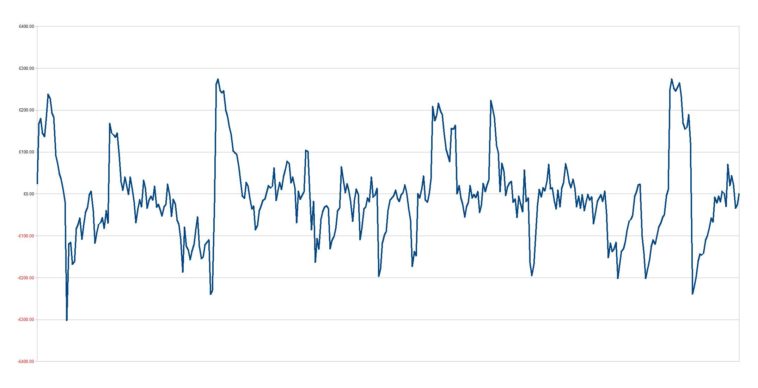
Data visualization : 2 years of dating, We would note how much we spent when going out to keep track on who’s turn it was to pay. (In the minuses it was my turn to pay, plus hers). [OC]
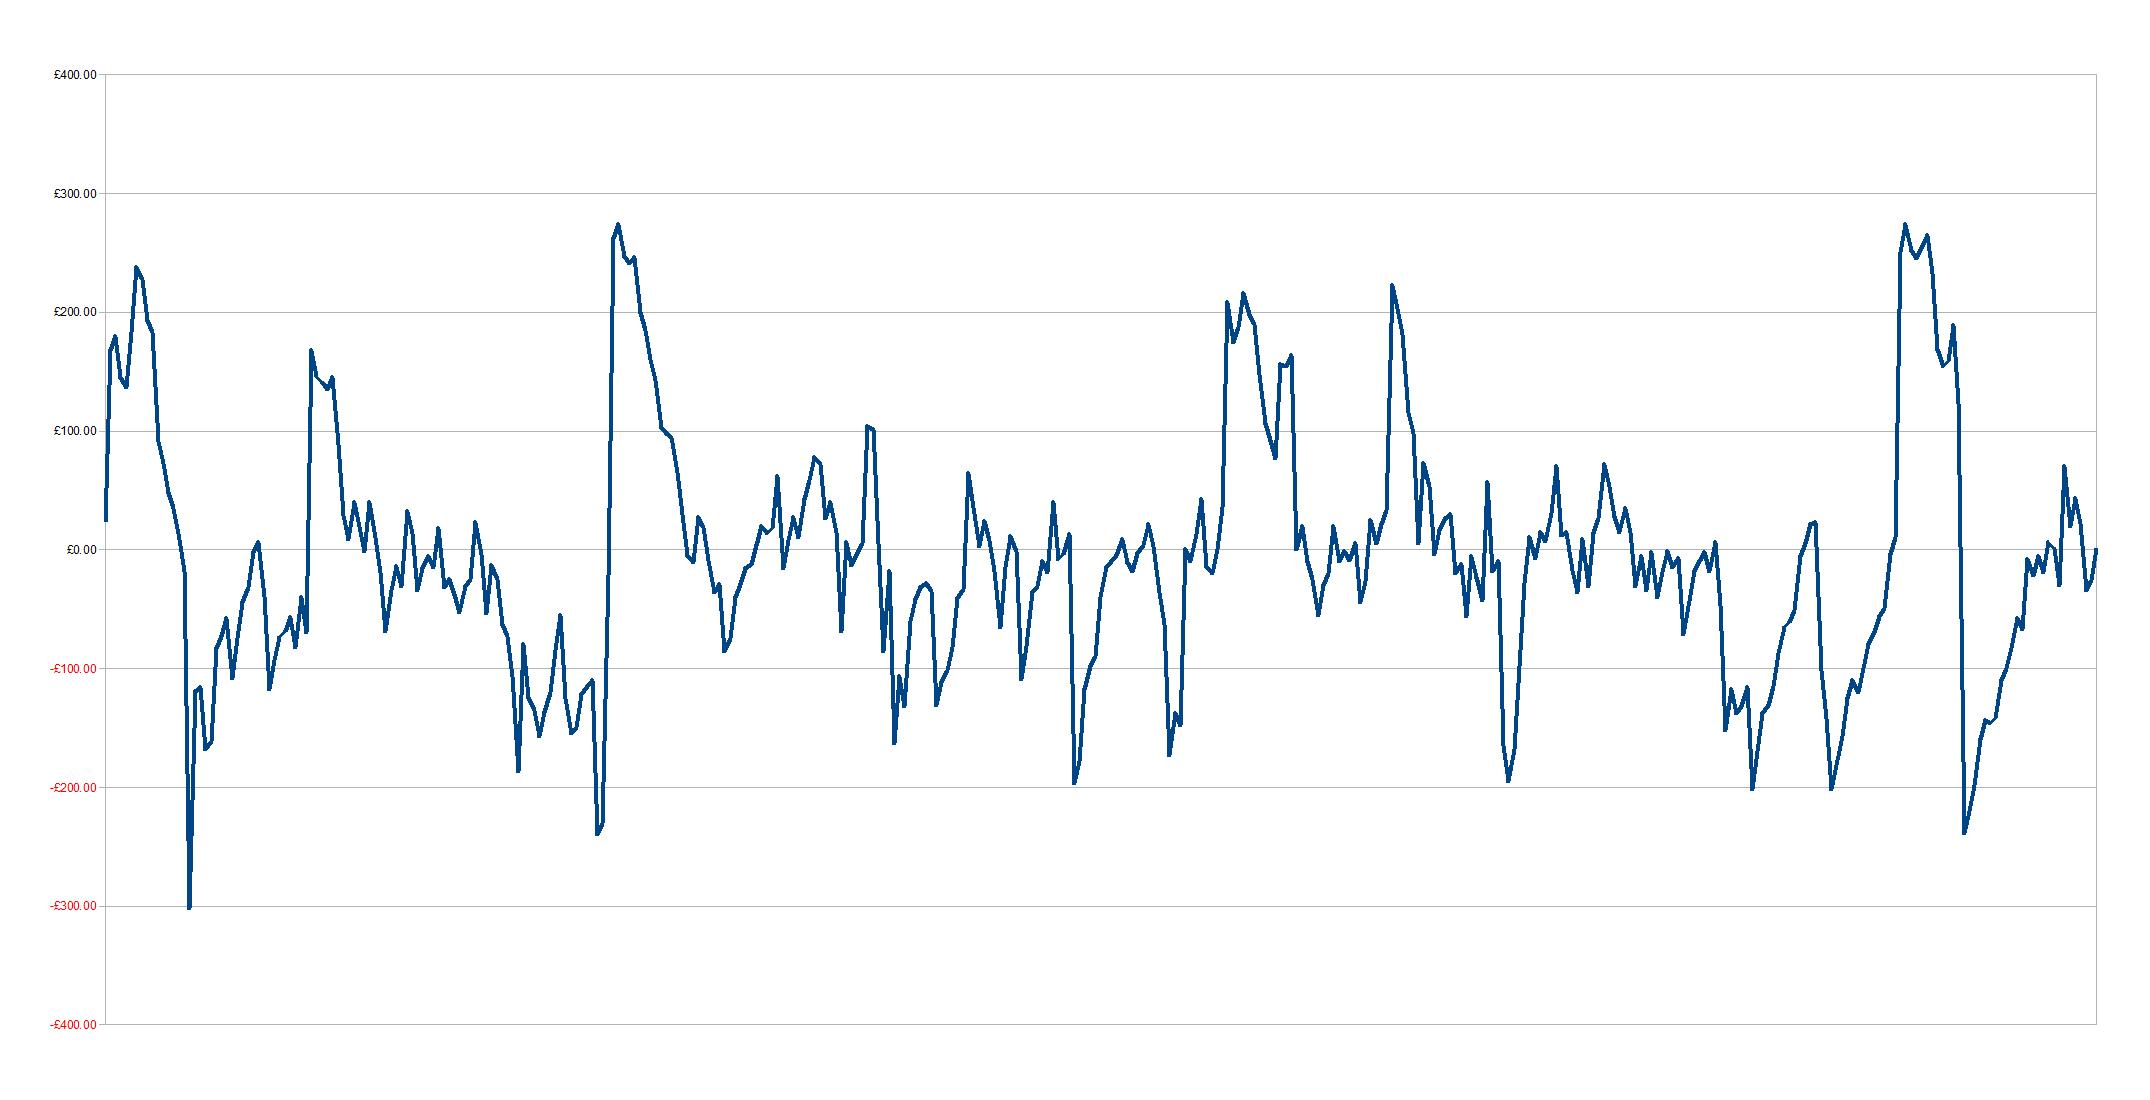
2 years of dating, We would note how much we spent when going out to keep track on who’s turn it was to pay. (In the minuses it was my turn to pay, plus hers). [OC]
By Greg1987
At infographic.tv we provide handpicked collection of the best infographics and data charts from around the world.