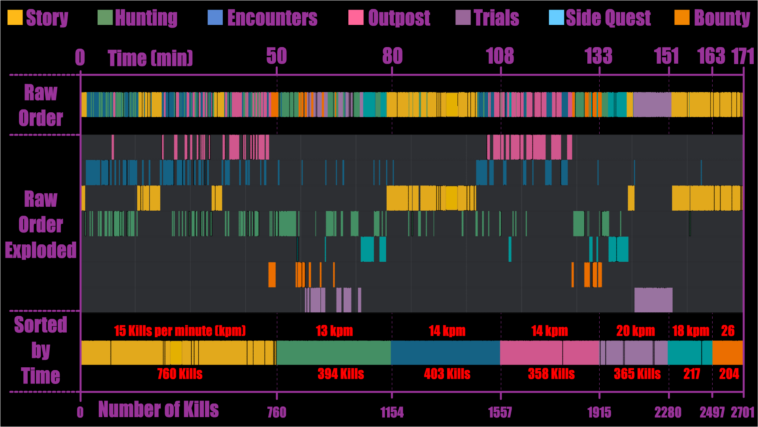
Infographic : Captured, compiled & categorized every fight in a Far Cry 3 playthrough. Determined the number of kills/min for each scenario type. Each thin line represents one fight clip.
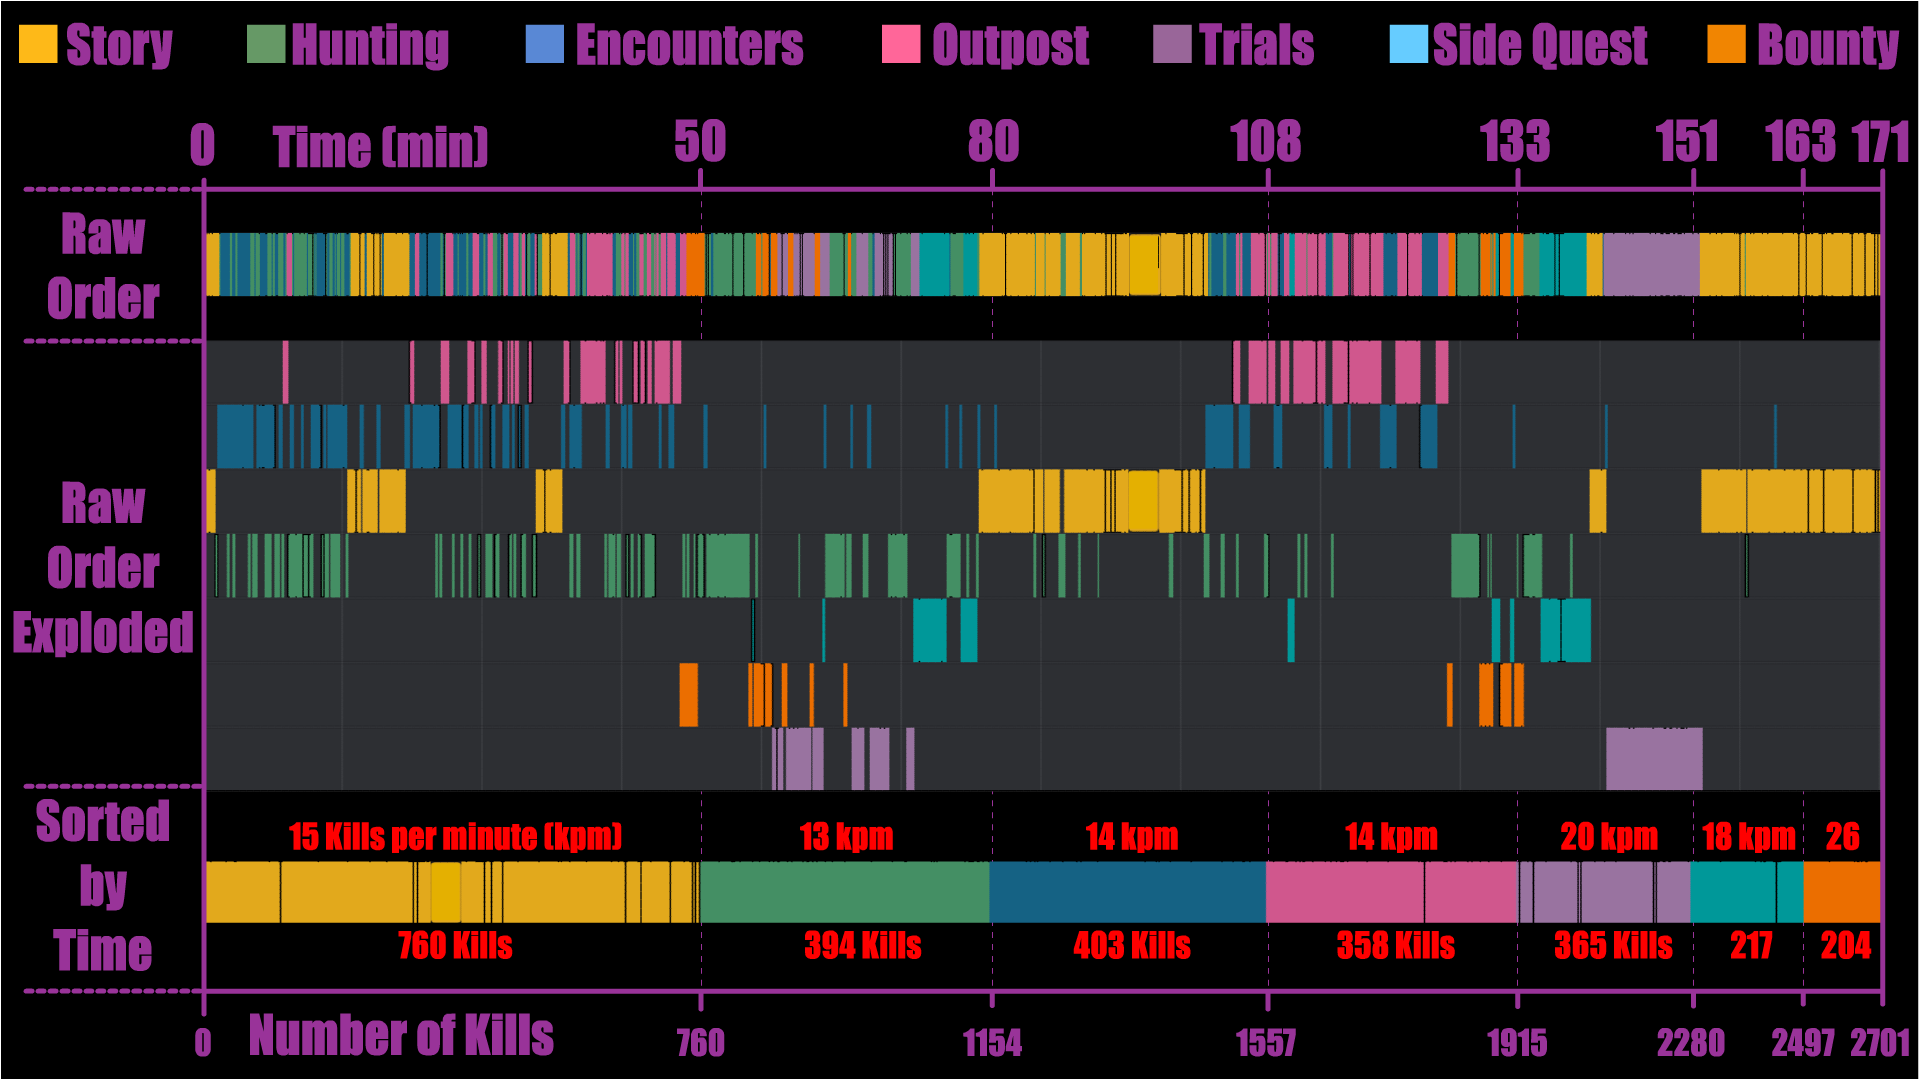
Captured, compiled & categorized every fight in a Far Cry 3 playthrough. Determined the number of kills/min for each scenario type. Each thin line represents one fight clip.
By lightandcolorlab
Information graphics, visual representations of data known as infographics, keep the web going these days. Web users, with their diminishing attention spans, are inexorably drawn to these shiny, brightly coloured messages with small, relevant, clearly-displayed nuggets of information. They’re straight to the point, usually factually interesting and often give you a wake-up call as to what those statistics really mean.
At infographic.tv we provide handpicked collection of the best infographics and data charts from around the world.