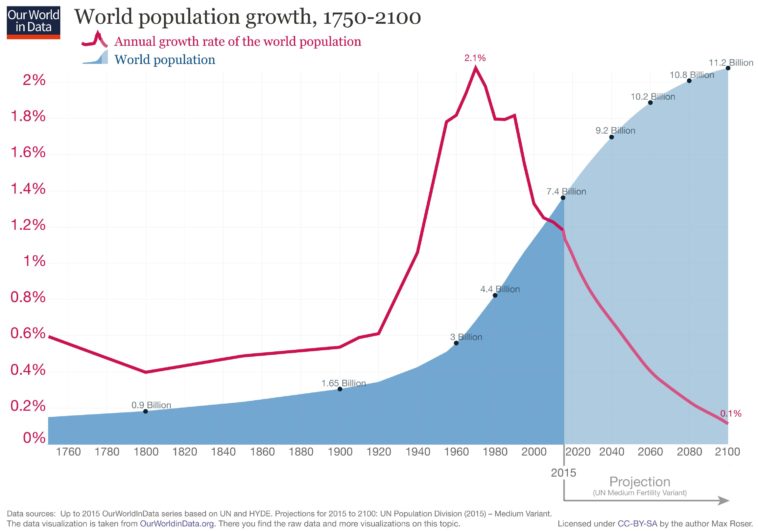
Data visualization : A breakdown of how the world population growth is changing
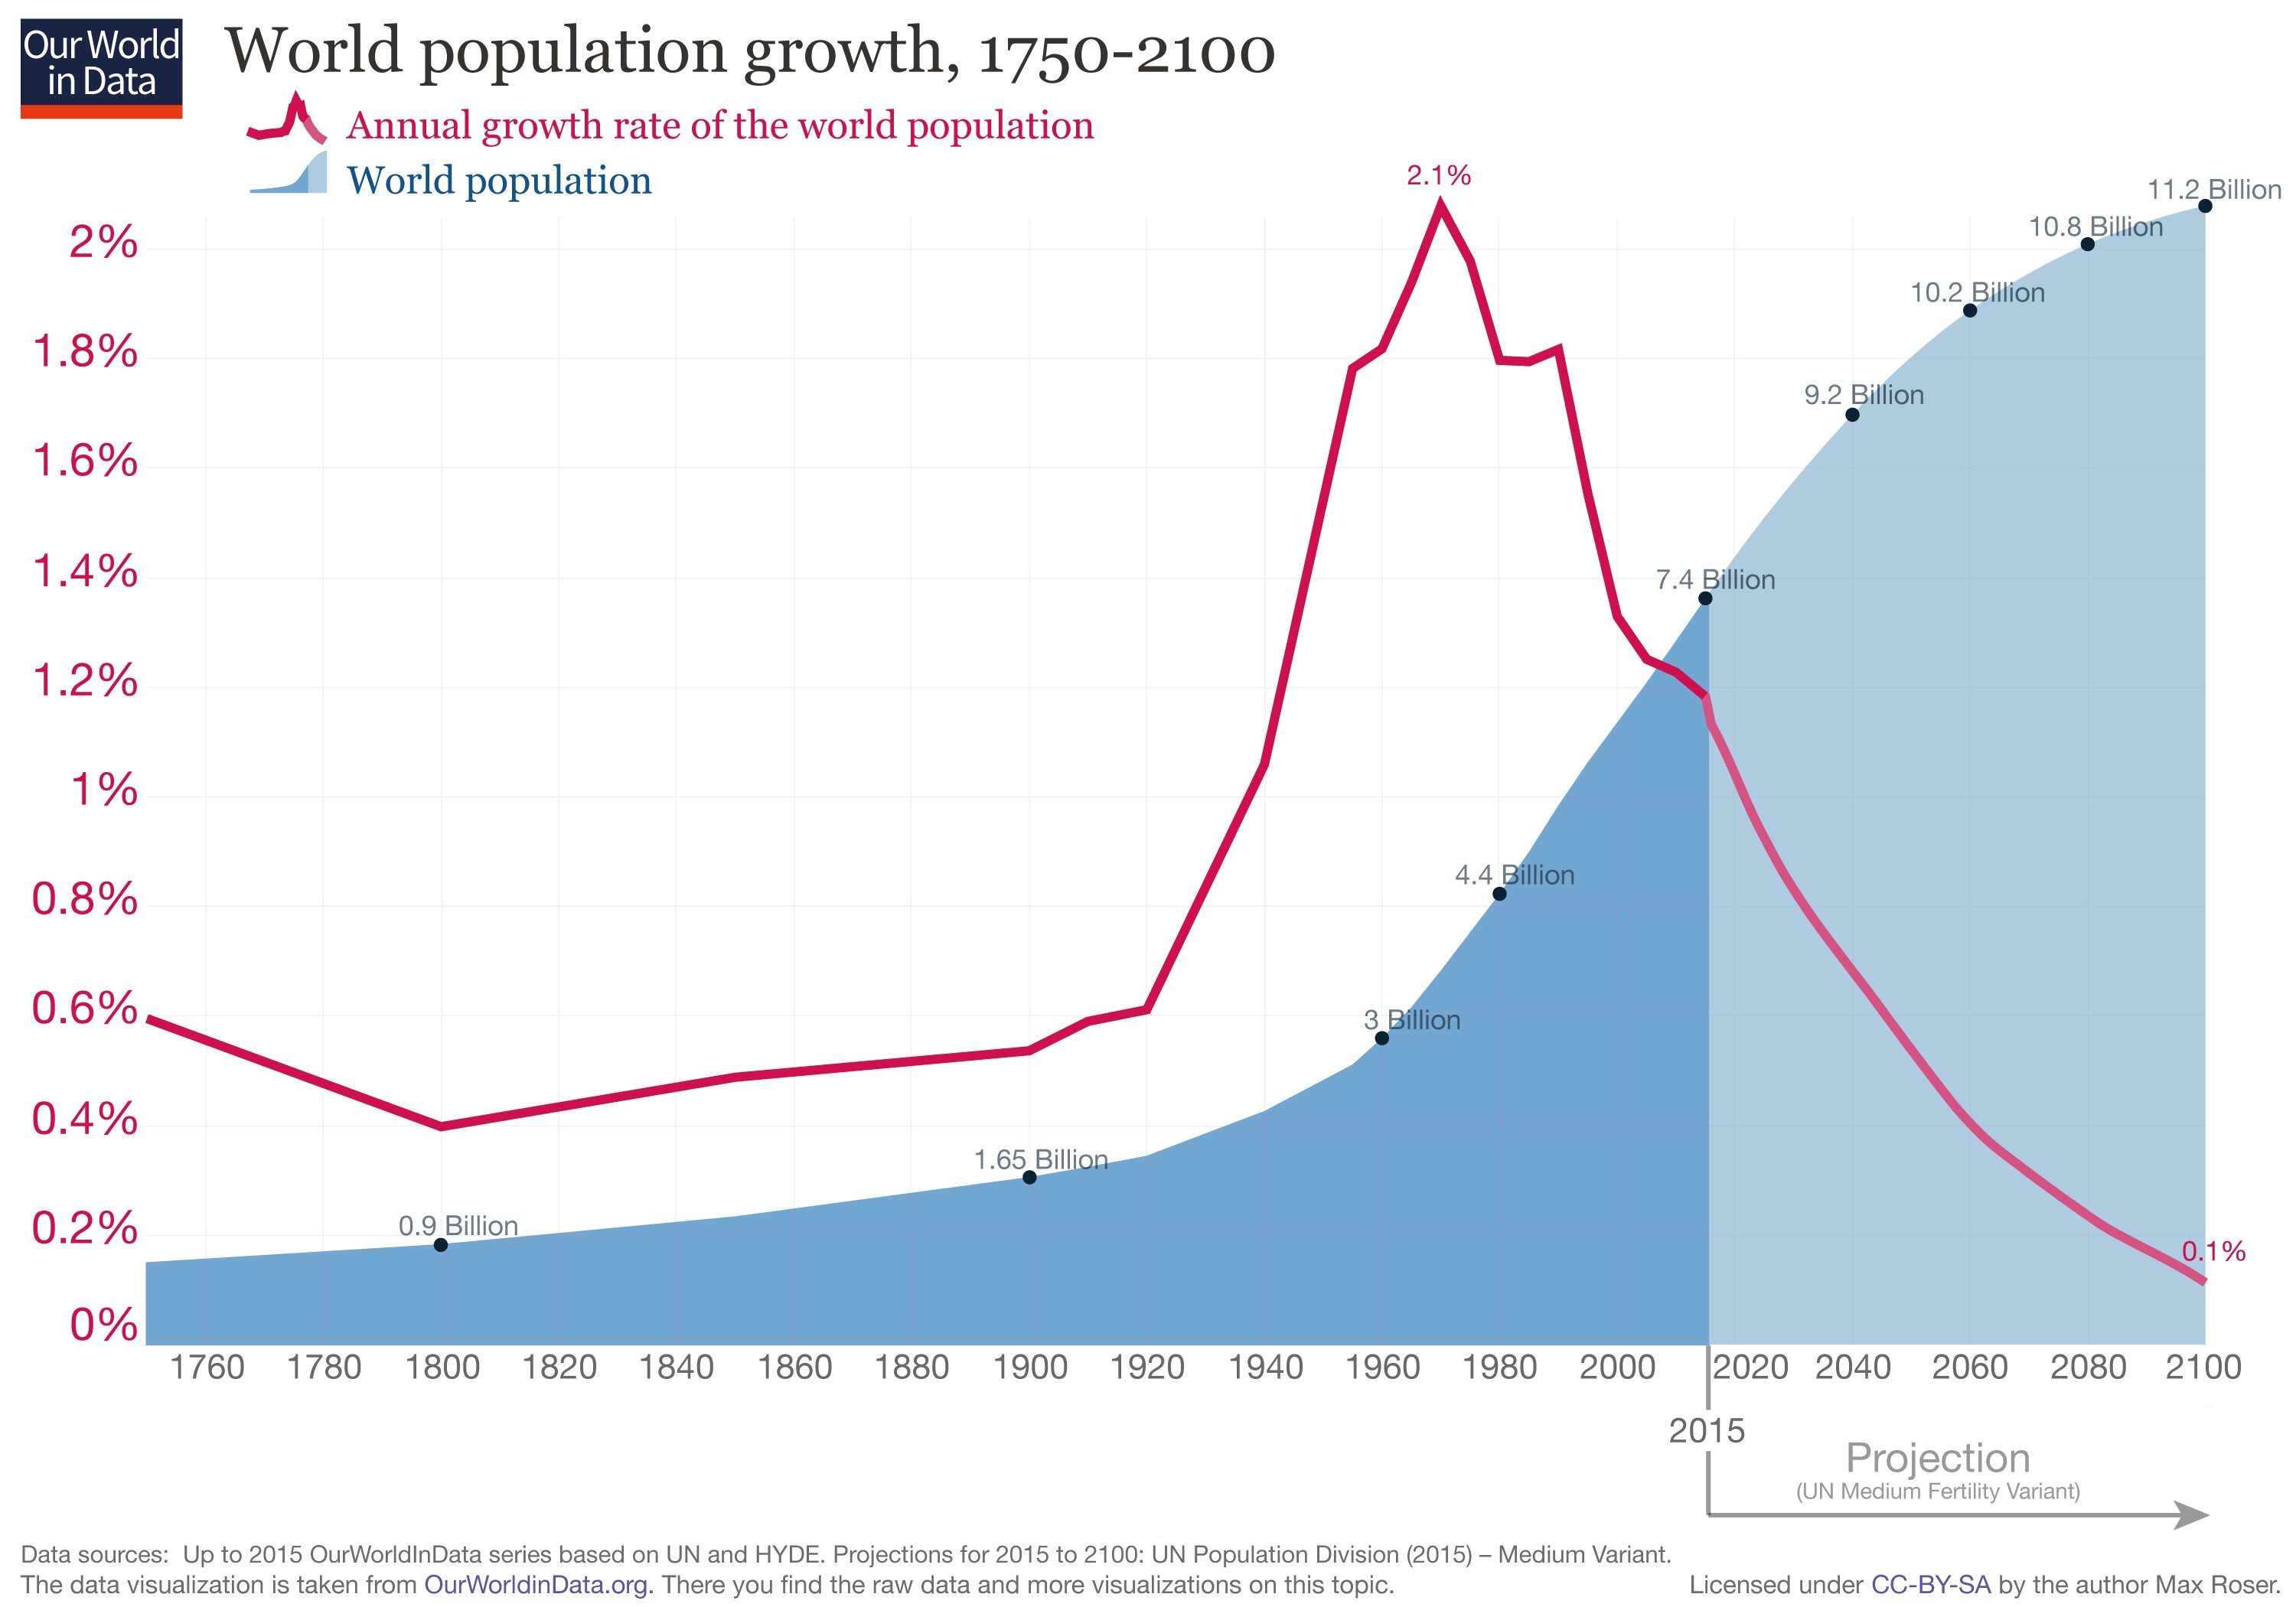
A breakdown of how the world population growth is changing
By BrachiopodsRcool
At infographic.tv we provide handpicked collection of the best infographics and data charts from around the world.