in

data visualization : A visualization of free, partly free, and not free countries across the world after 13 consecutive years of democratic decline.

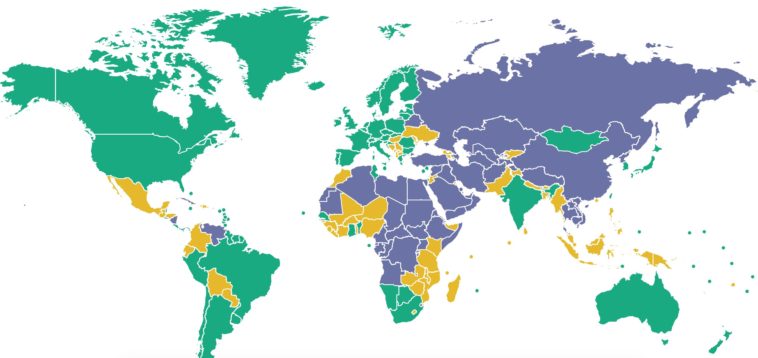
Data visualization : A visualization of free, partly free, and not free countries across the world after 13 consecutive years of democratic decline.

A visualization of free, partly free, and not free countries across the world after 13 consecutive years of democratic decline.

By veronicacholula

At infographic.tv we provide handpicked collection of the best infographics and data charts from around the world.

  • Don’t forget to share the love !
  • What do you think?

    459 points
    Upvote Downvote

    Leave a Reply

    Your email address will not be published. Required fields are marked *

    Loading…

    Data Chart : New Years Goals For You And Your Pet [Infographic

    Data Chart : Video Games Can Improve Your Health [Infographic