in

data visualization : Baltimore Homicides: an interactive map showing all the killings in the city. Brought to us by the Baltimore Sun.
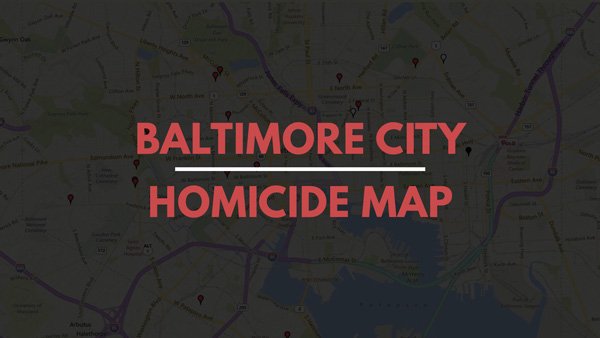
Data visualization : Baltimore Homicides: an interactive map showing all the killings in the city. Brought to us by the Baltimore Sun.

Baltimore Homicides: an interactive map showing all the killings in the city. Brought to us by the Baltimore Sun.

By Roughneck16

At infographic.tv we provide handpicked collection of the best infographics and data charts from around the world.


  • Don’t forget to share the love !
  • What do you think?

    459 points
    Upvote Downvote

    Leave a Reply

    Your email address will not be published. Required fields are marked *

    Loading…

    Infographic : Deadliest pandemics of the past 100 years, and which ones may be next

    Chart : Should You Take a Personal Loan? [Decision Tree]