Data visualization : Chart of the day (century?): Price changes 1997 to 2017
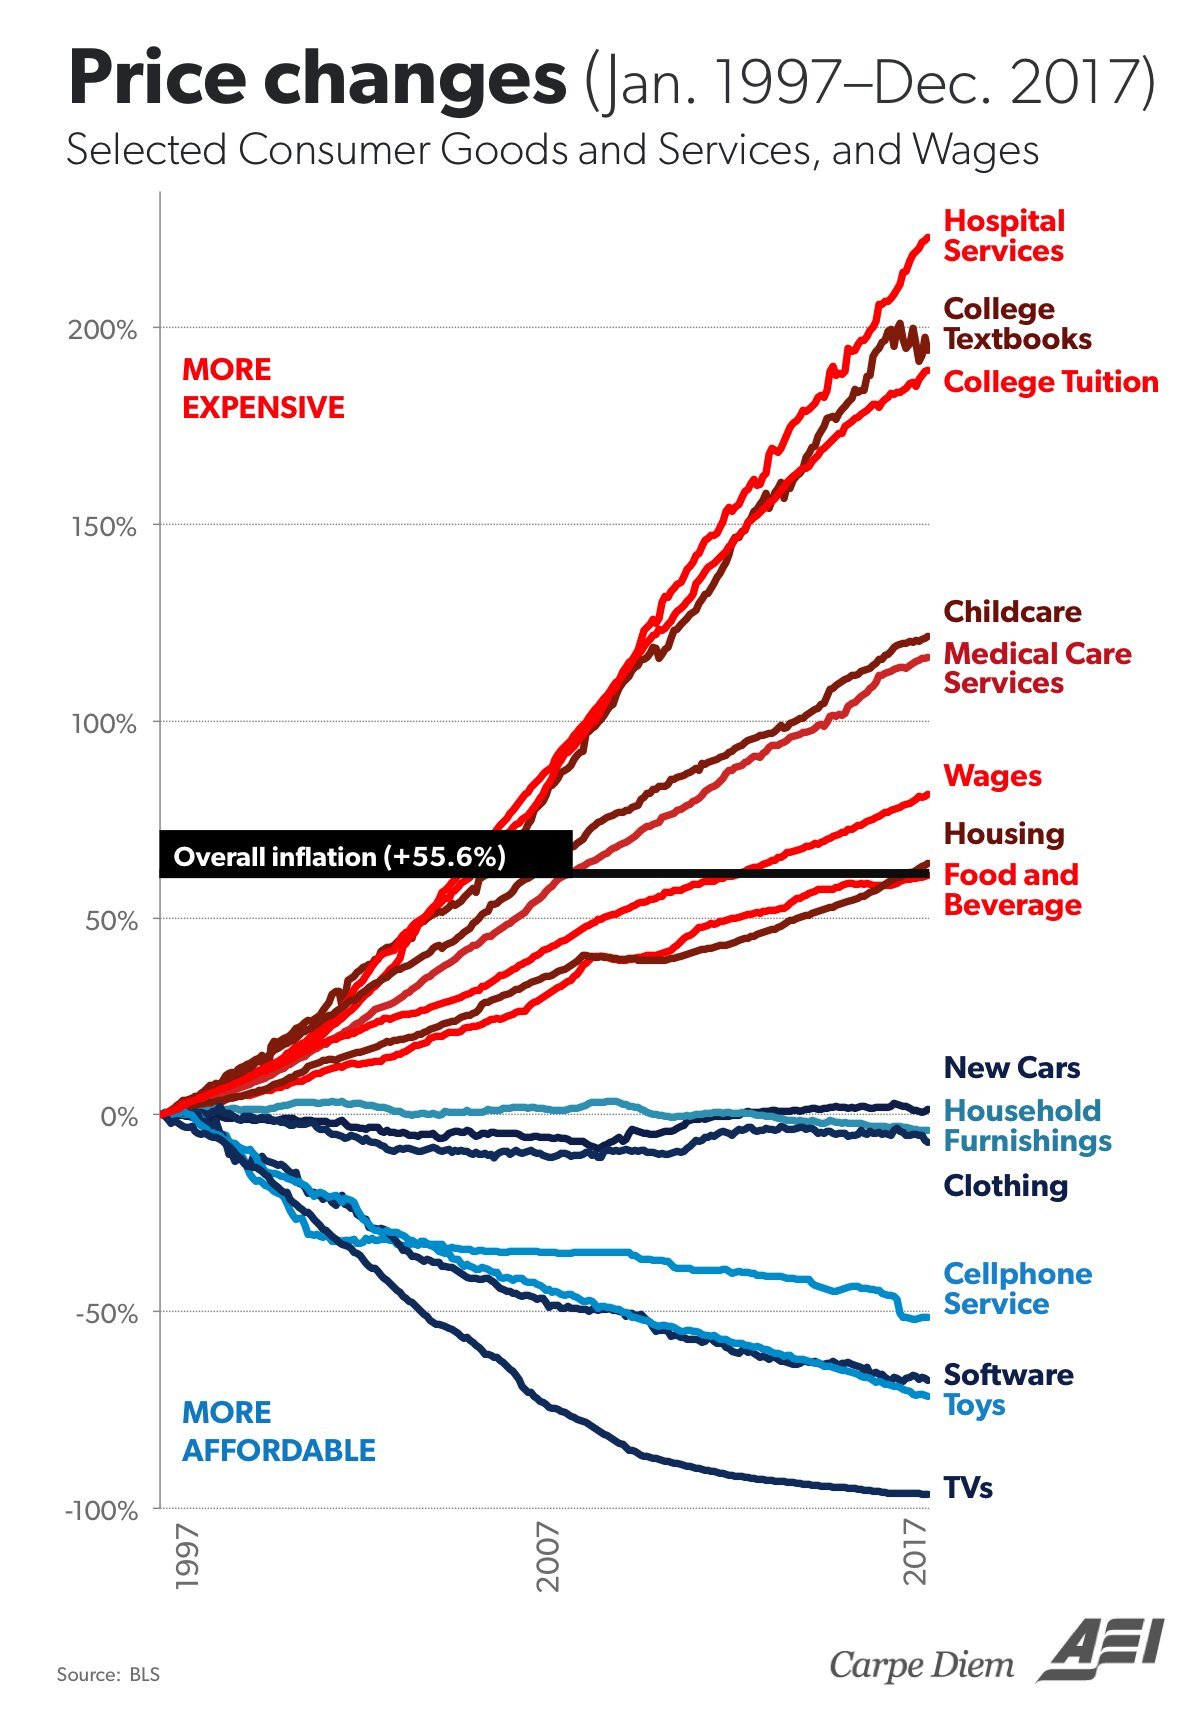
Chart of the day (century?): Price changes 1997 to 2017
By caudron
At infographic.tv we provide handpicked collection of the best infographics and data charts from around the world.