Data visualization : Daily Mean Arctic Temperatures 1958 – 2018 [OC]
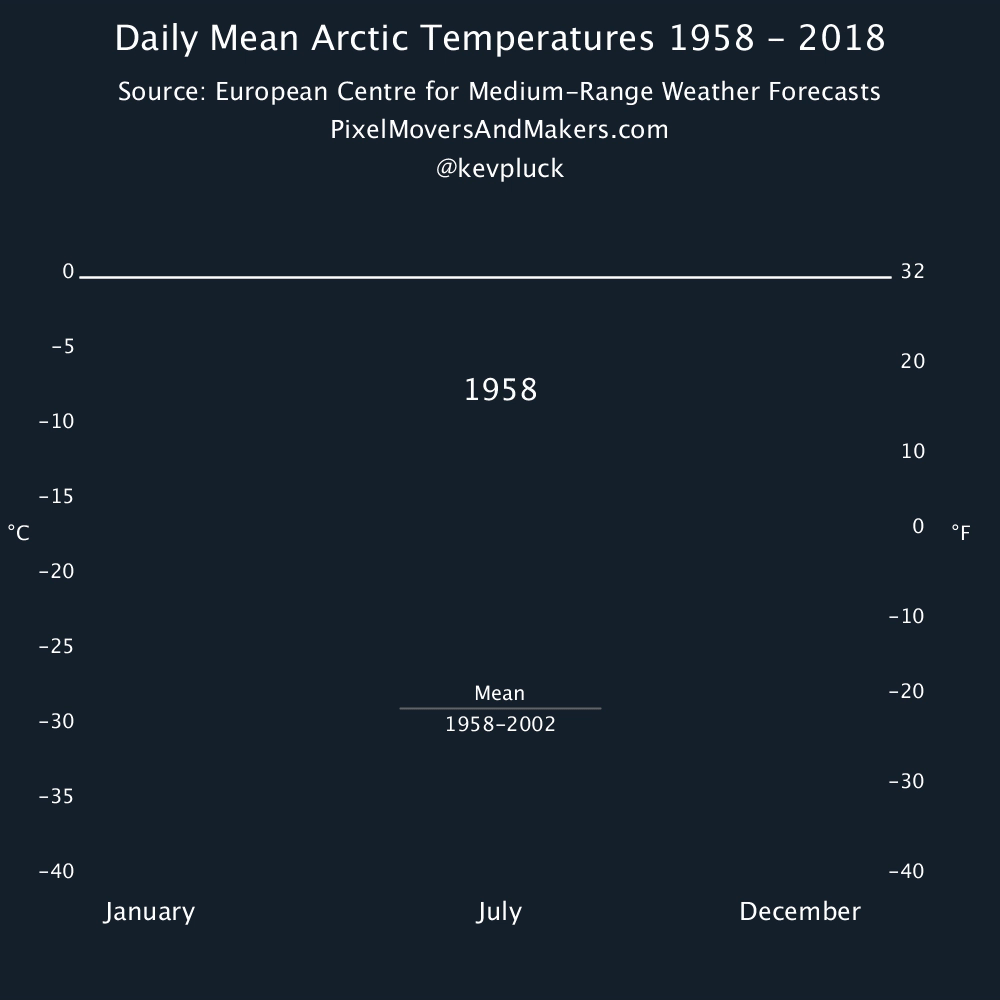
Daily Mean Arctic Temperatures 1958 – 2018 [OC]
By kevpluck
At infographic.tv we provide handpicked collection of the best infographics and data charts from around the world.
Here you'll find all collections you've created before.