Data visualization : Depiction of those killed or seriously injured in urban areas in the UK 2017
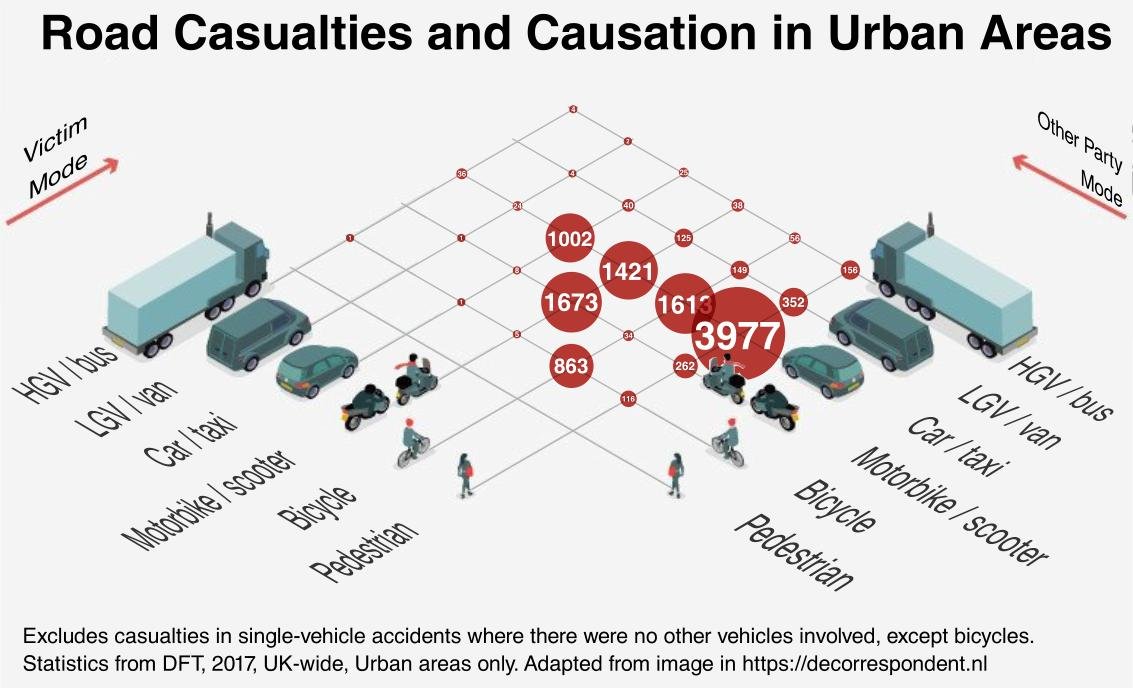
Depiction of those killed or seriously injured in urban areas in the UK 2017
By haggur
At infographic.tv we provide handpicked collection of the best infographics and data charts from around the world.