in

data visualization : Drug-related deaths in the US by state since 1999 [OC]

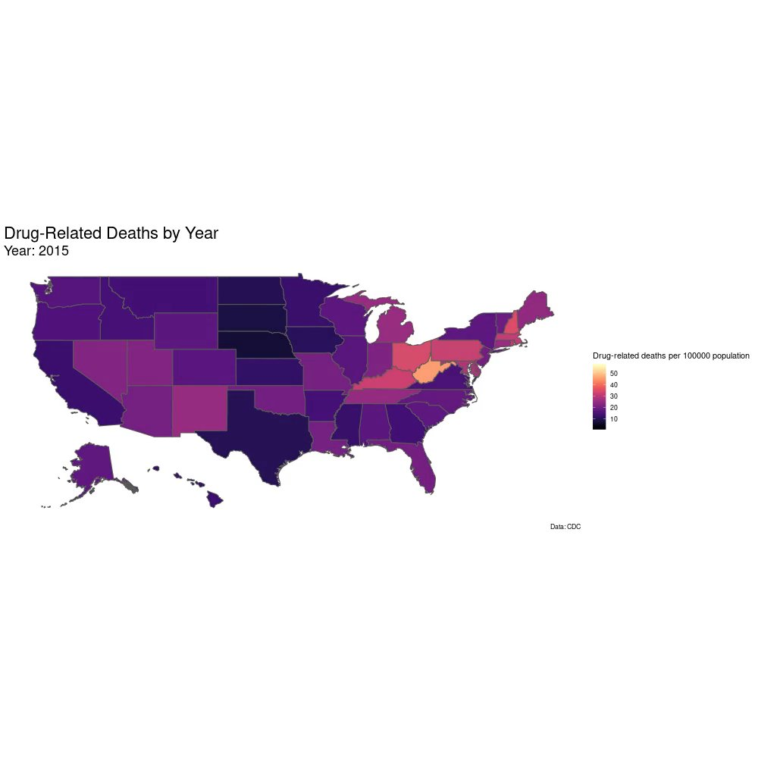
Data visualization : Drug-related deaths in the US by state since 1999 [OC]

Drug-related deaths in the US by state since 1999 [OC]

By nicholes_erskin

At infographic.tv we provide handpicked collection of the best infographics and data charts from around the world.

  • Don’t forget to share the love !
  • What do you think?

    459 points
    Upvote Downvote

    Leave a Reply

    Your email address will not be published. Required fields are marked *

    Loading…

    Video Infographic : Minecraft vs Roblox – How Do They Compare? – Video Game Comparison

    Video Infographic : 2. How to add items (icons, images, text) to your infographic in Piktochart