Data visualization : Estimating and Graphing Pi using a Monte Carlo simulation with 1 million points [OC]
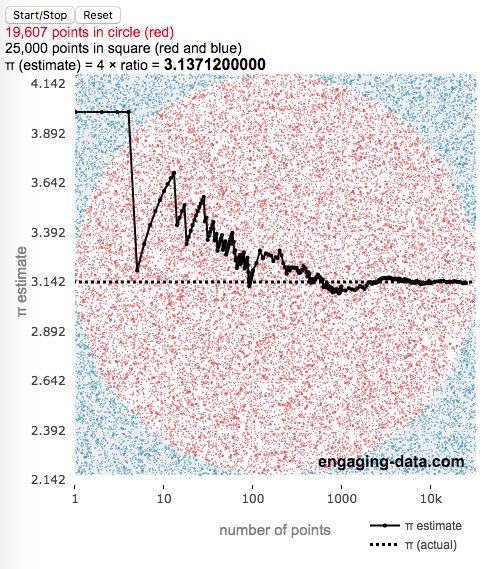
Estimating and Graphing Pi using a Monte Carlo simulation with 1 million points [OC]
By EngagingData
At infographic.tv we provide handpicked collection of the best infographics and data charts from around the world.