Data visualization : Every time I drove my car over the last 7 months [OC]
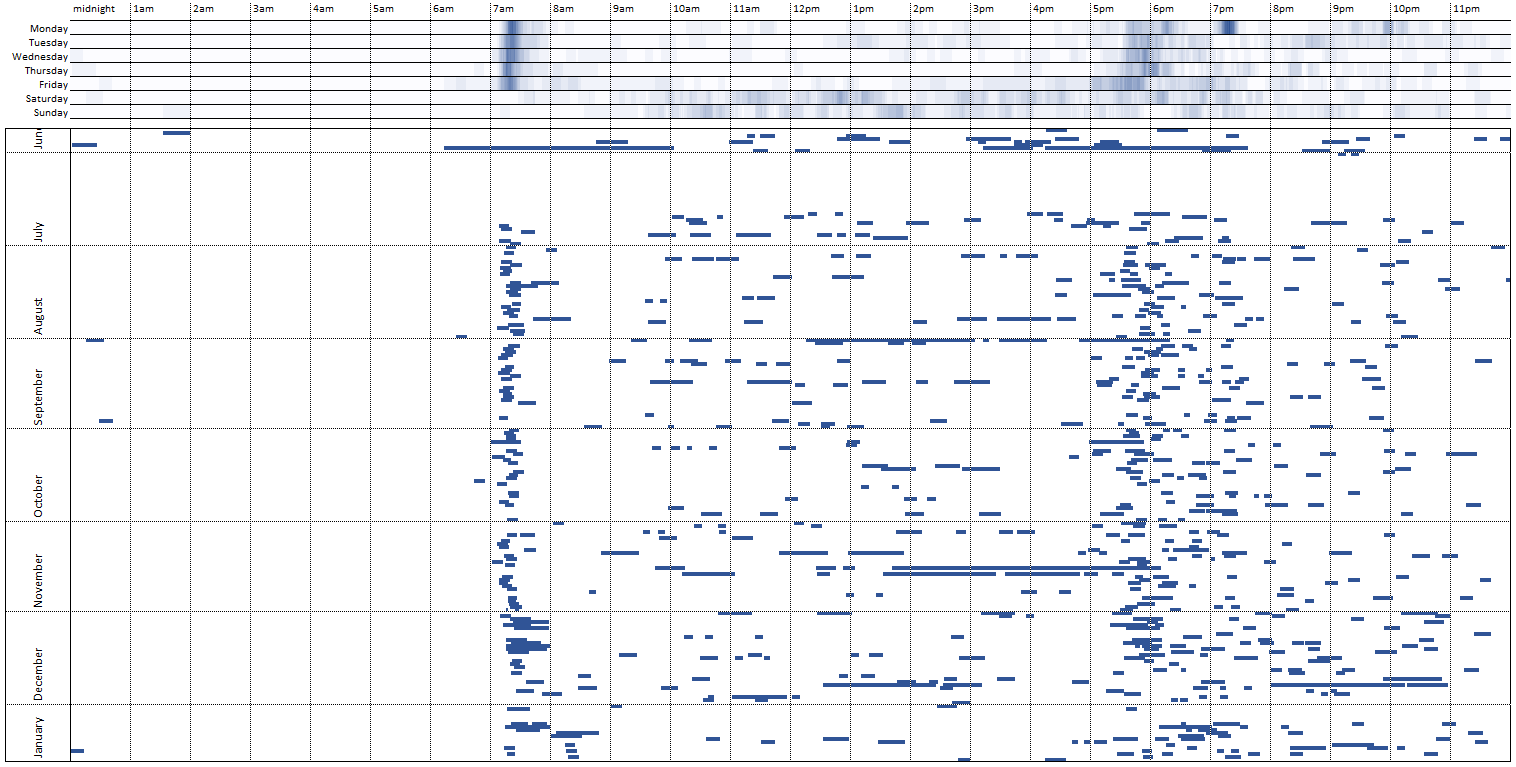
Every time I drove my car over the last 7 months [OC]
By Narwhal-Queen
At infographic.tv we provide handpicked collection of the best infographics and data charts from around the world.