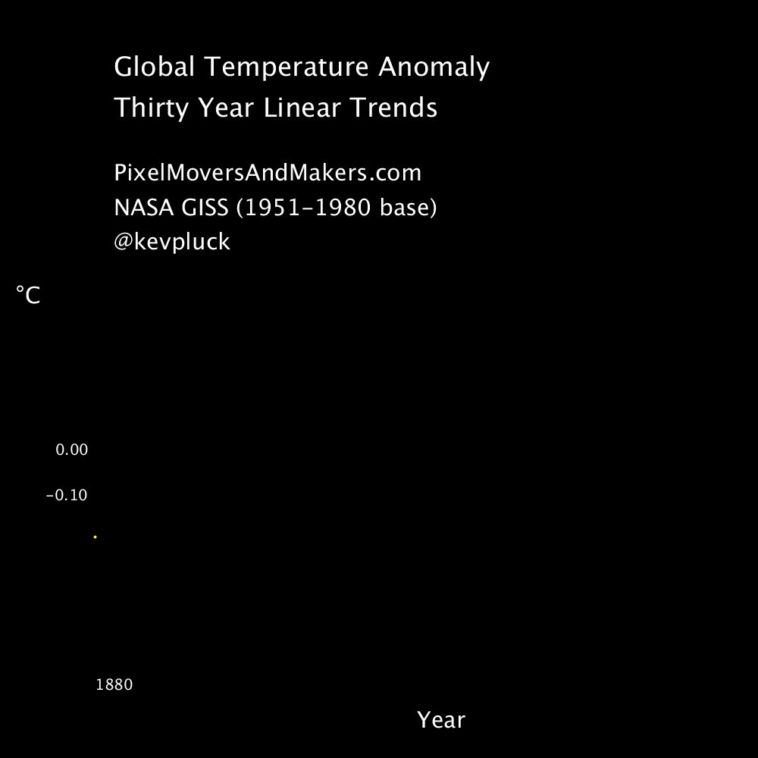
Data visualization : Global Temperature Anomaly Thirty Year Linear Trends [OC]
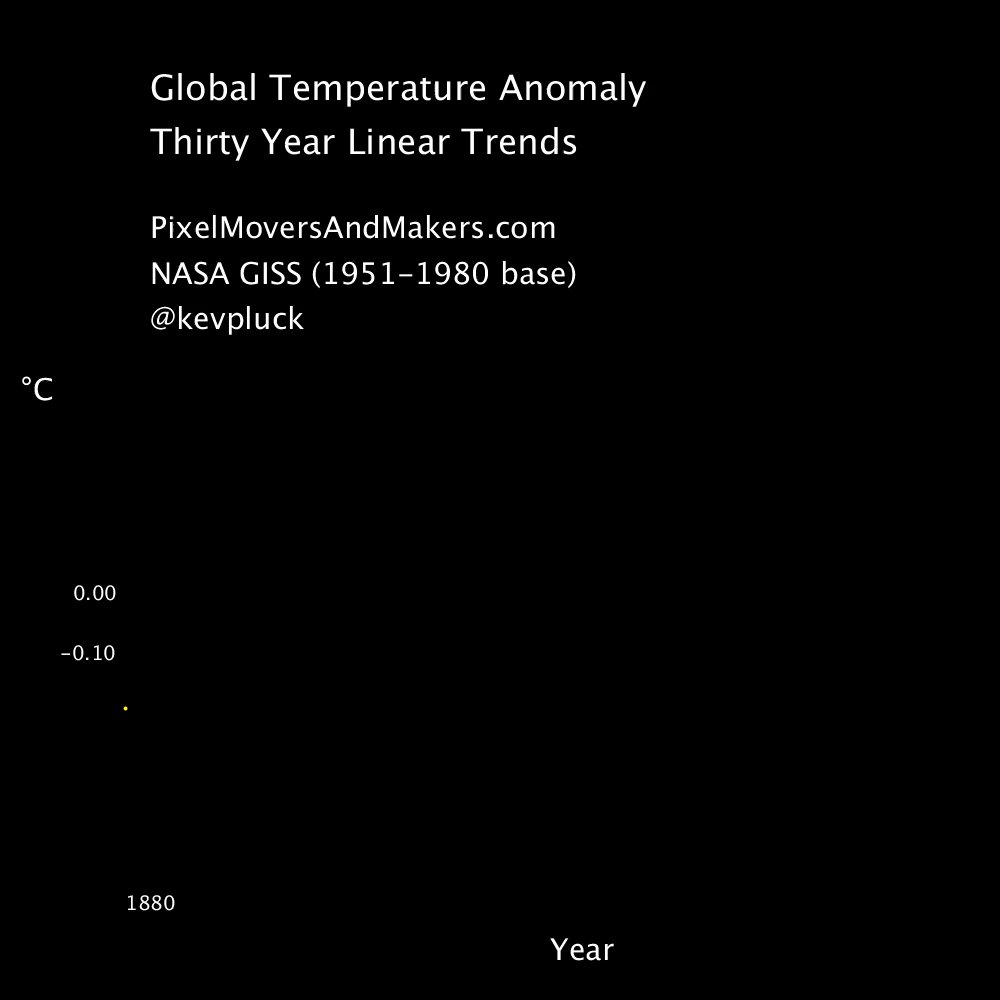
Global Temperature Anomaly Thirty Year Linear Trends [OC]
By kevpluck
At infographic.tv we provide handpicked collection of the best infographics and data charts from around the world.