Data visualization : I modeled my heart rate recovery from running over various temperature ranges [OC]
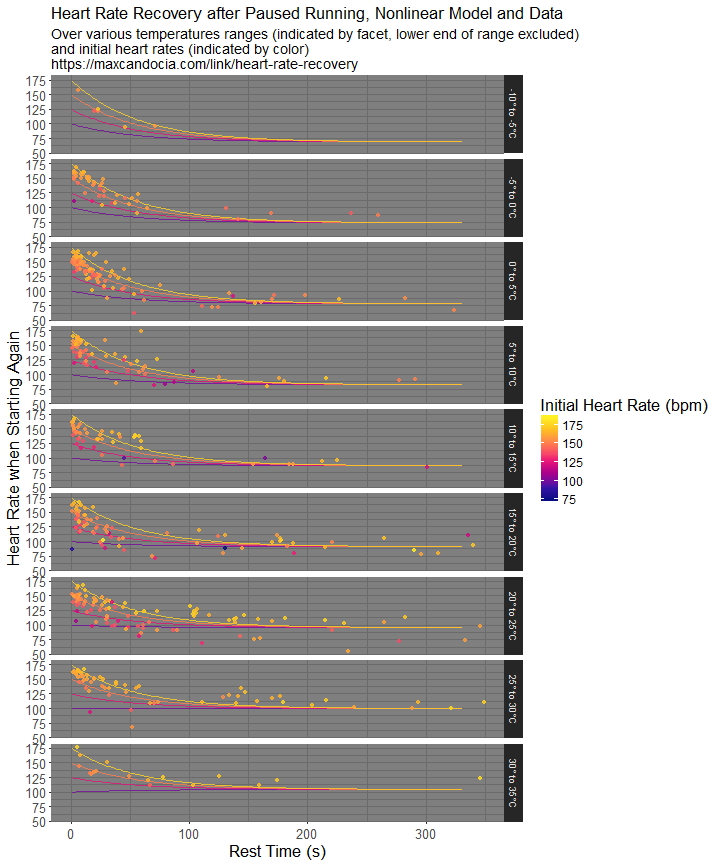
I modeled my heart rate recovery from running over various temperature ranges [OC]
By antirabbit
At infographic.tv we provide handpicked collection of the best infographics and data charts from around the world.