Data visualization : I put together the data and photos of a recent scuba diving trip to Sangalaki (East Borneo, Indonesia) in a visual and interactive format. Here’s what it looks like. Interactive link inside comments. [OC]
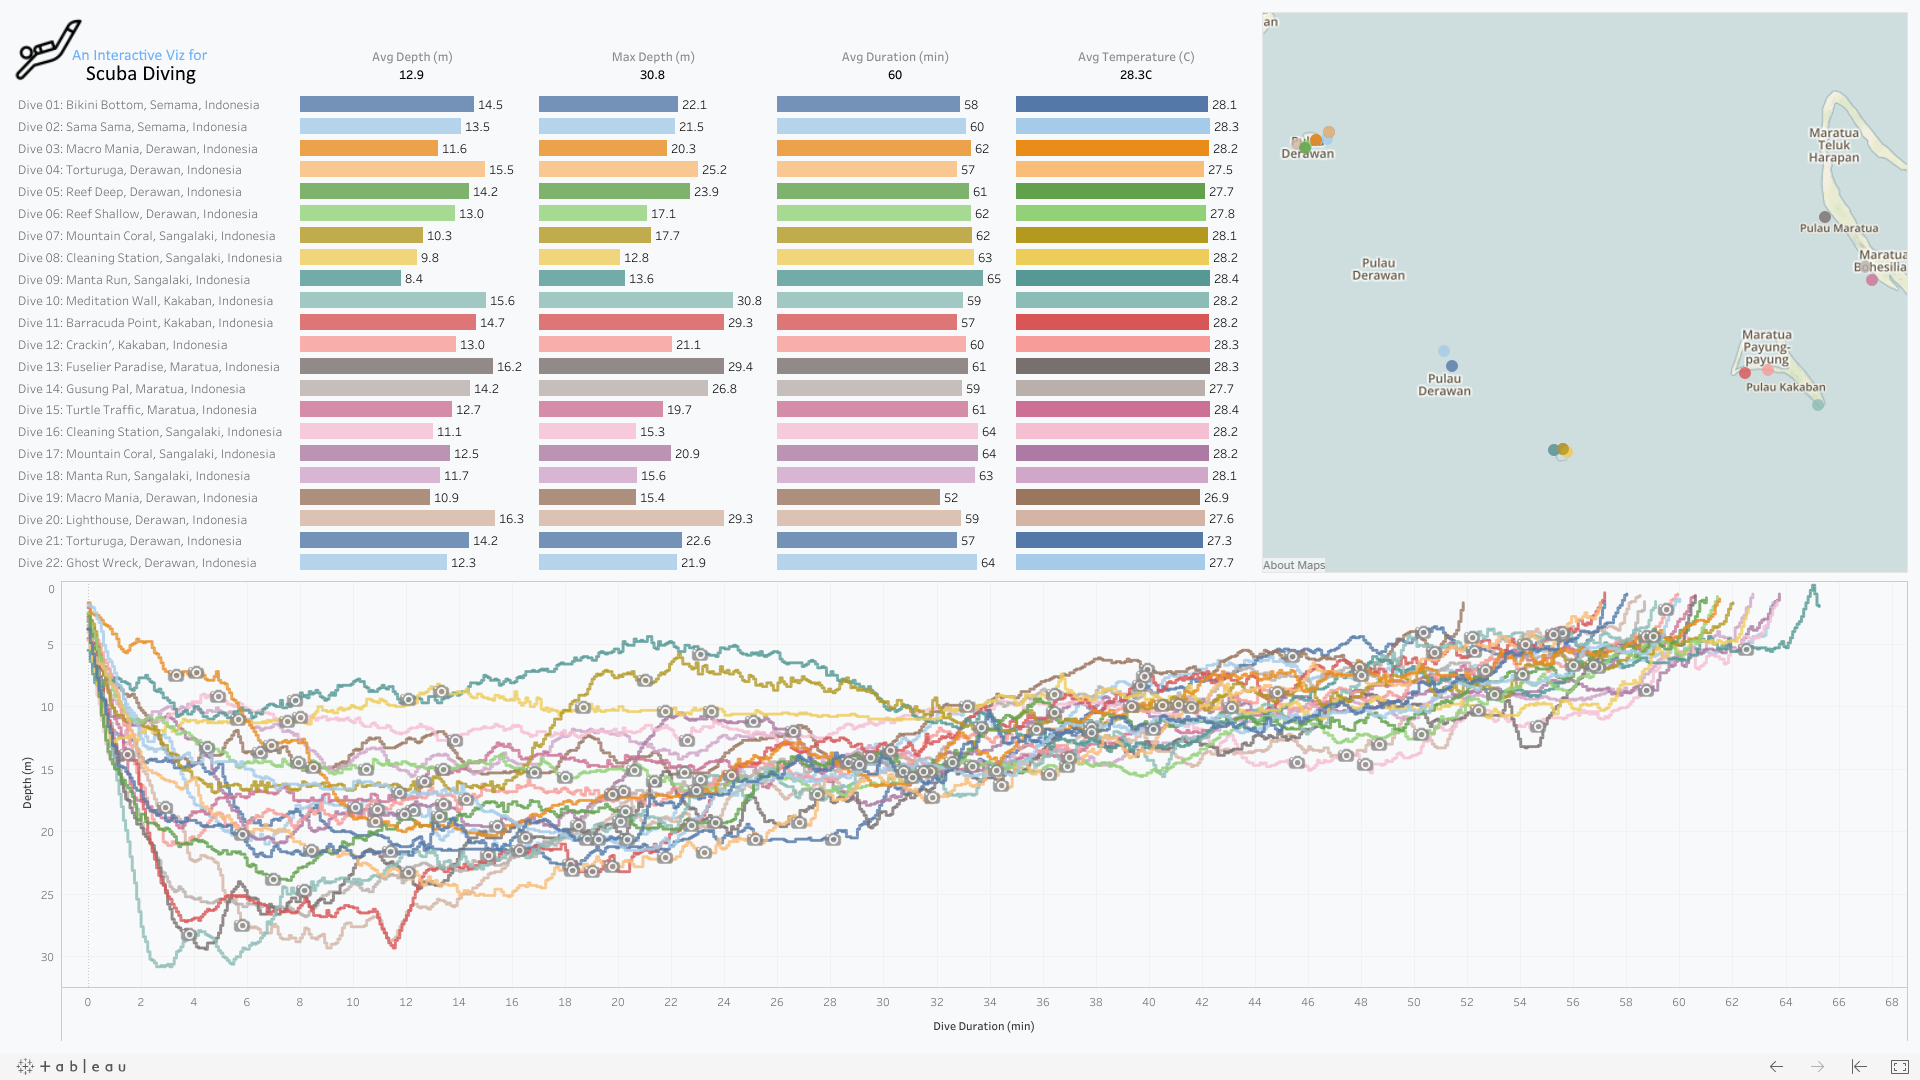
I put together the data and photos of a recent scuba diving trip to Sangalaki (East Borneo, Indonesia) in a visual and interactive format. Here’s what it looks like. Interactive link inside comments. [OC]
By intrepidk
At infographic.tv we provide handpicked collection of the best infographics and data charts from around the world.