in

data visualization : I spent over 1000 hours researching and illustrating this map of Melbourne. [OC]

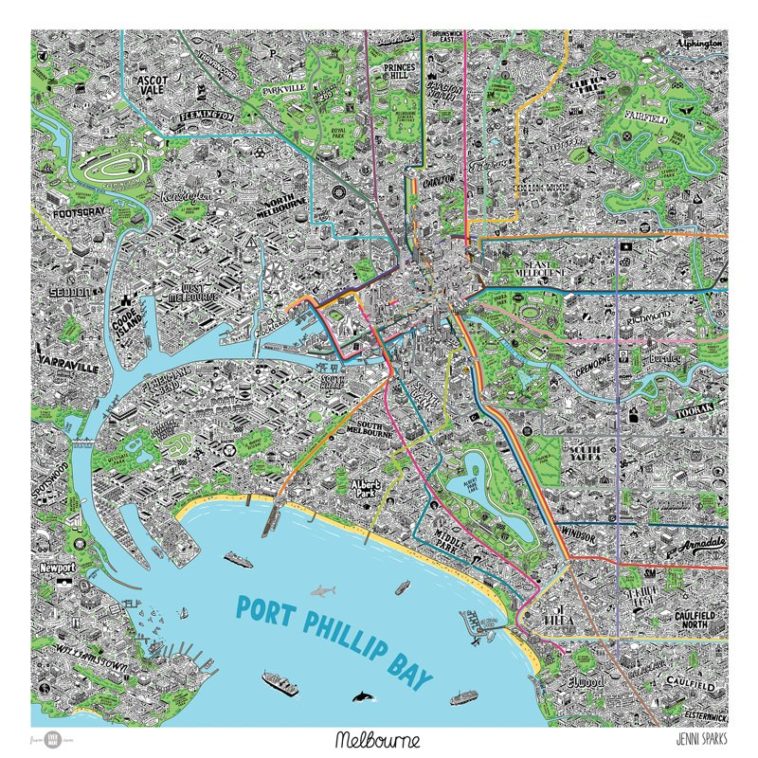
Data visualization : I spent over 1000 hours researching and illustrating this map of Melbourne. [OC]

I spent over 1000 hours researching and illustrating this map of Melbourne. [OC]

By willdrawforbooze

At infographic.tv we provide handpicked collection of the best infographics and data charts from around the world.

  • Don’t forget to share the love !
  • What do you think?

    459 points
    Upvote Downvote

    Leave a Reply

    Your email address will not be published. Required fields are marked *

    Loading…

    Infographic : Top 10 Holiday Travel Destinations [Fixed]

    Chart : How to make pounded yam using a smoothie maker