Data visualization : In the UK, year 3 is the toughest period for startups. Keep your annual revenue over £110K per employee to survive. [OC]
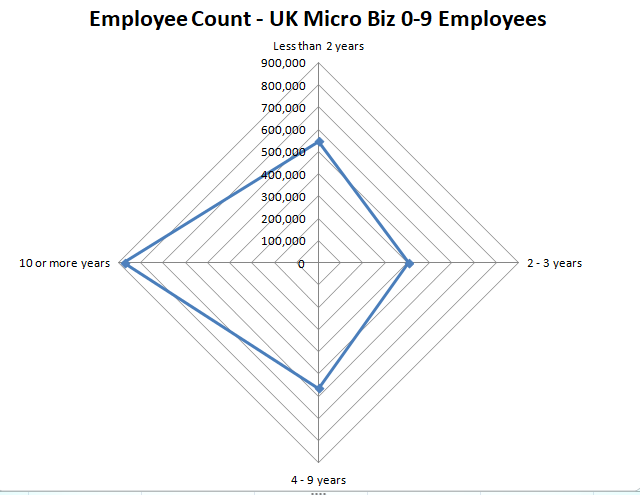
In the UK, year 3 is the toughest period for startups. Keep your annual revenue over £110K per employee to survive. [OC]
By digentre
At infographic.tv we provide handpicked collection of the best infographics and data charts from around the world.