in

data visualization : [OC] A relationship between global mean temperatures and global meat production

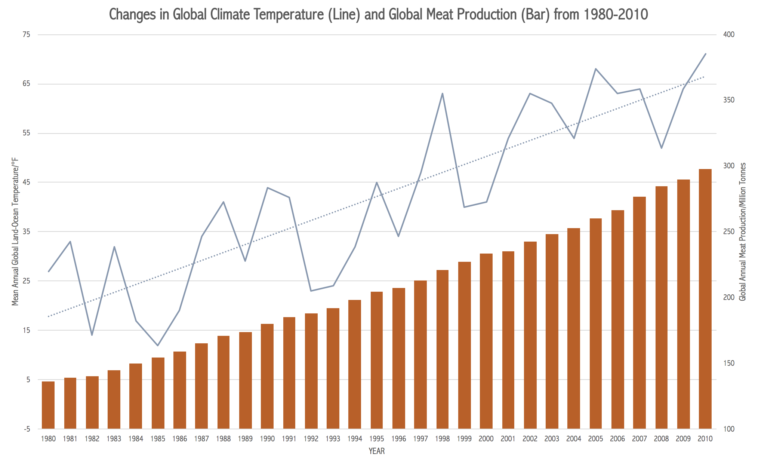
Data visualization : [OC] A relationship between global mean temperatures and global meat production

[OC] A relationship between global mean temperatures and global meat production

By galetan

At infographic.tv we provide handpicked collection of the best infographics and data charts from around the world.

  • Don’t forget to share the love !
  • What do you think?

    459 points
    Upvote Downvote

    Leave a Reply

    Your email address will not be published. Required fields are marked *

    Loading…

    Map : The PVI (Partisan Voting Index) of each state. Demonstrates how democratic or republican each state is.

    Video Infographic : Automate Excel using Python – Xlwings | Series 1: Case Study I Infographic