Data visualization : [OC] Made this infographic/visual story for a class – “From Central America to the Southern Border”
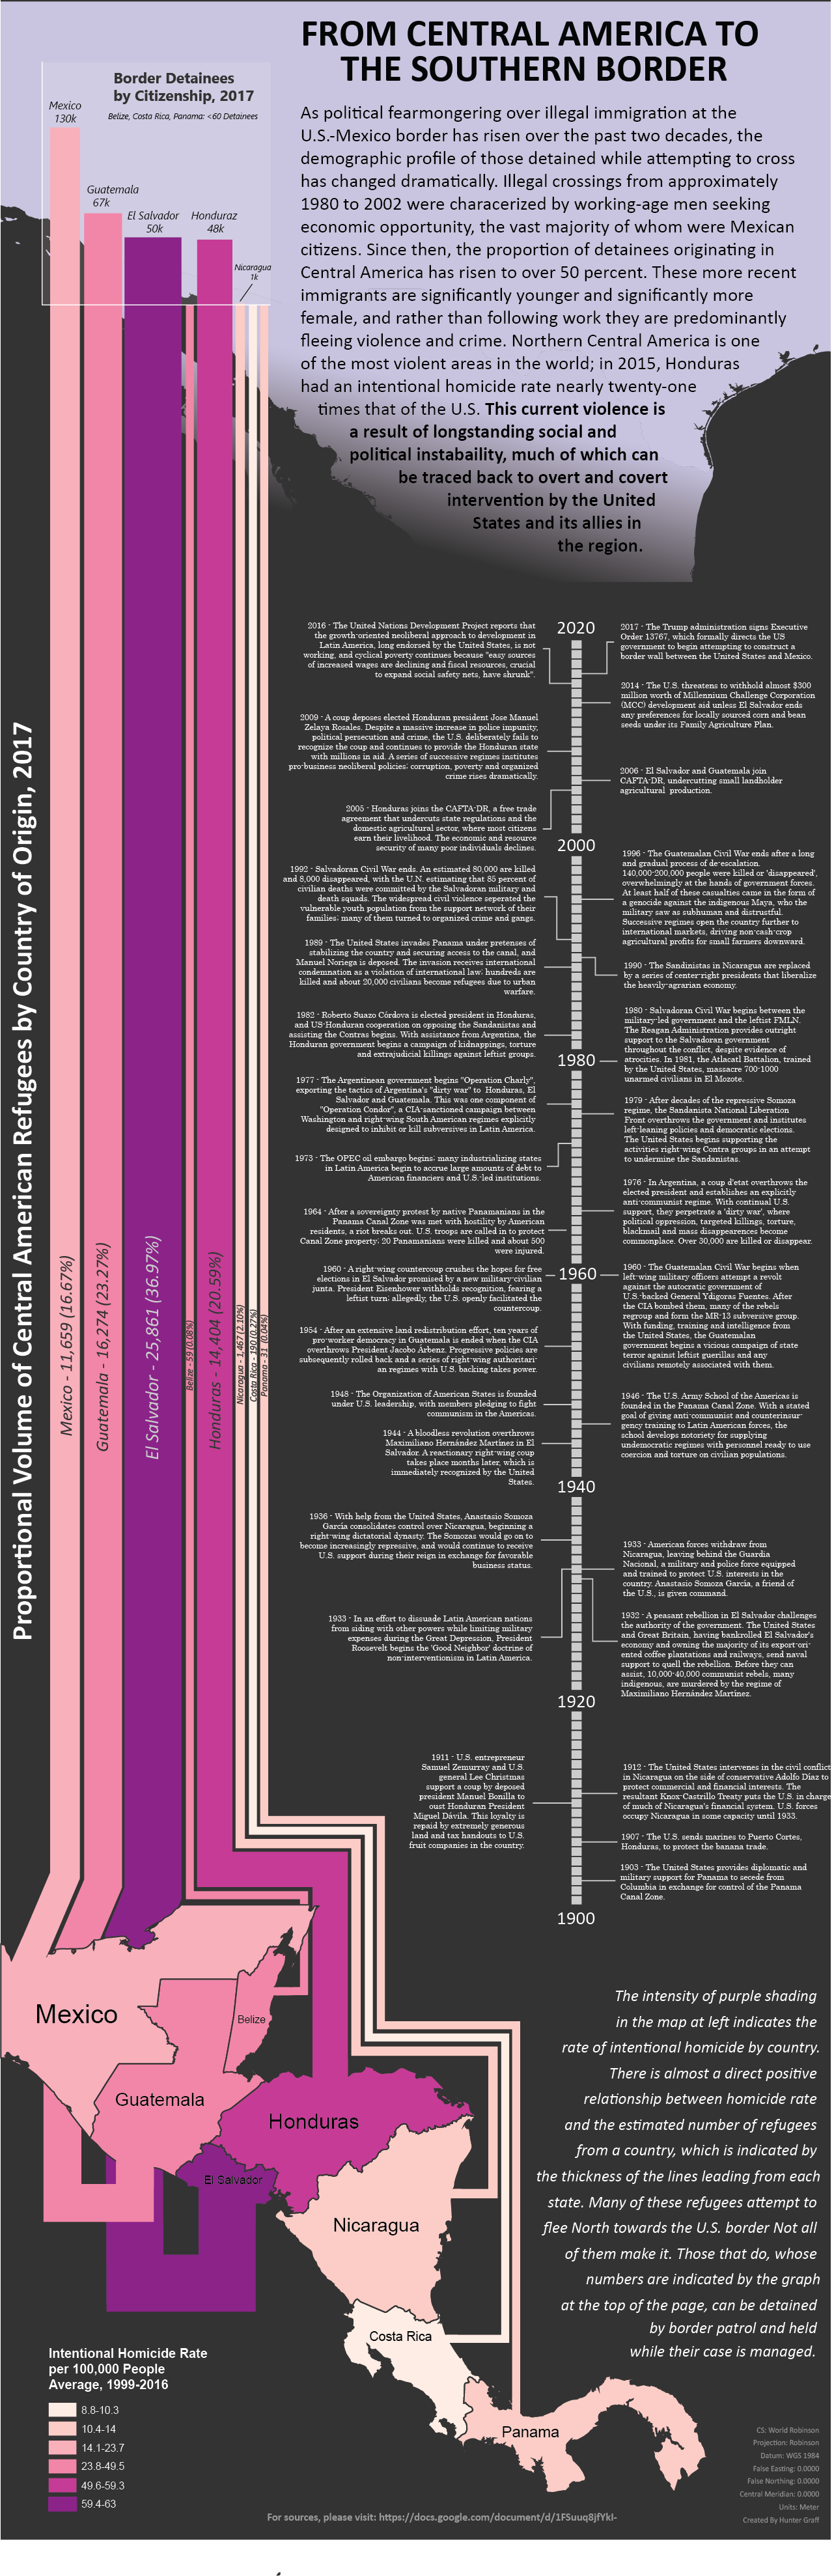
[OC] Made this infographic/visual story for a class – “From Central America to the Southern Border”
By mapaccount
At infographic.tv we provide handpicked collection of the best infographics and data charts from around the world.