Data visualization : [OC] People per Dunkin’ | Percent Drive-Through Dunkins
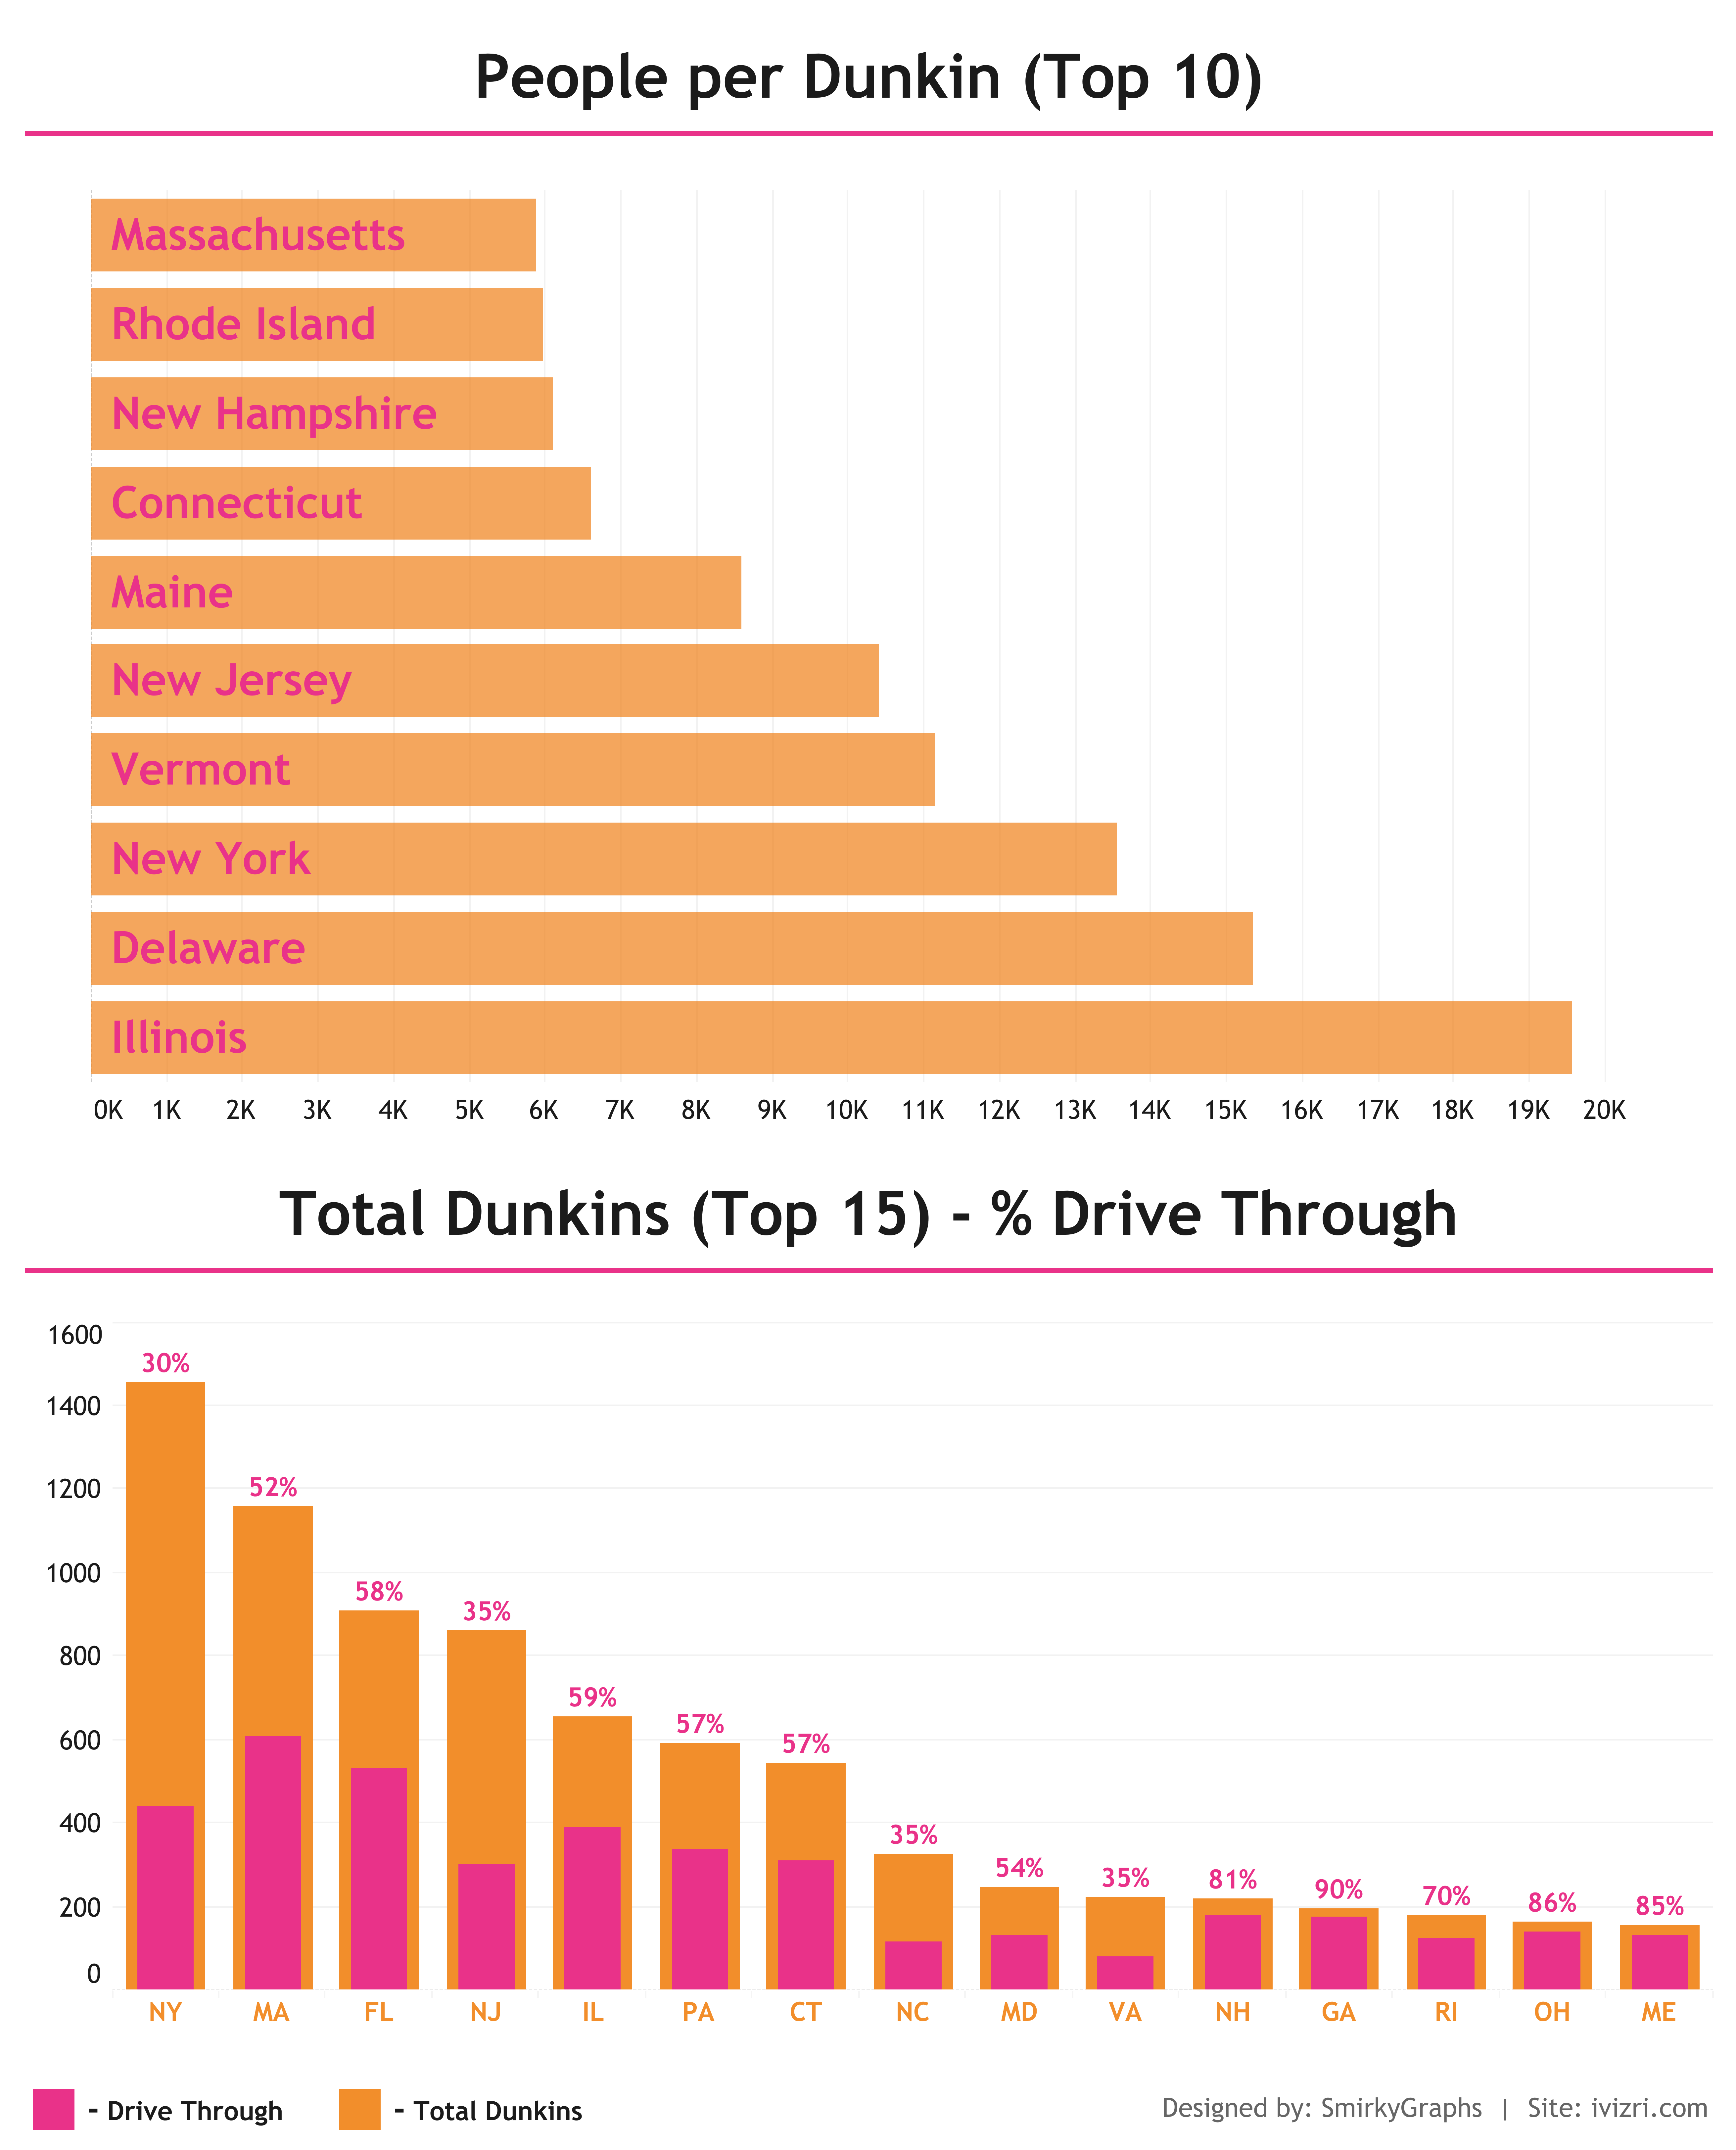
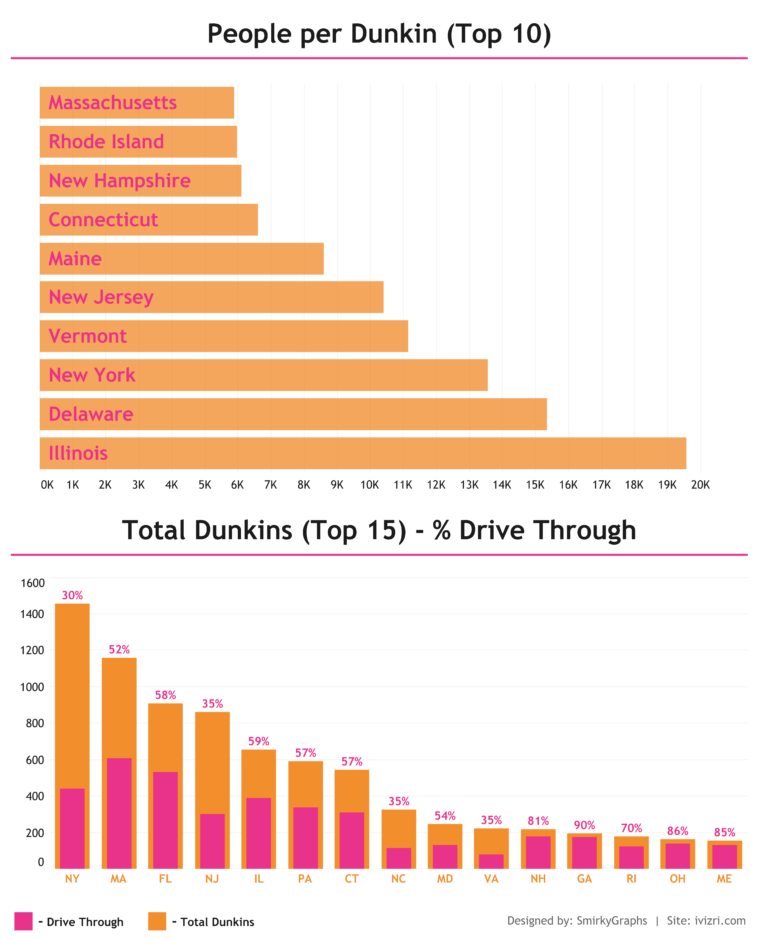
[OC] People per Dunkin’ | Percent Drive-Through Dunkins
By SmirkyGraphs
At infographic.tv we provide handpicked collection of the best infographics and data charts from around the world.