Data visualization : Simulating 6,000 Die Rolls – Visualization Created with R (source code included – see comments) [OC]
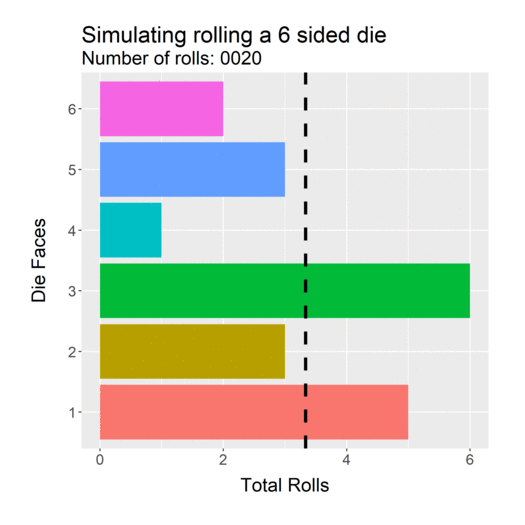
Simulating 6,000 Die Rolls – Visualization Created with R (source code included – see comments) [OC]
By Thaufas
At infographic.tv we provide handpicked collection of the best infographics and data charts from around the world.